Enable Log Analytics on your Azure Container Apps environment
Having access to real-time monitoring data for the Container Apps environment is useful, but you’ll also need to record this data and analyze historical activity or events. To support this, you’ll enable Log Analytics, a feature of Azure Monitor.
Using Log Analytics, your Azure Container Apps environment can record:
- Container console output (for example, stdout or stderr messages).
- System logs generated by the Azure Container Apps environment.
- Azure Springs App console logs.
To learn more about how Log Analytics works with Azure Container Apps, review:
Step-by-step guidance
If you’ve already successfully run the
create-azure-resources.shscript discussed in the installation instructions, skip to step 2.
-
In your command-line environment, create a new Log Analytics workspace:
WORKSPACE=la-$APPNAME-$UNIQUEID az monitor log-analytics workspace create \ --resource-group $RESOURCE_GROUP \ --workspace-name $WORKSPACE -
Enable logging for your Azure Container Apps environment:
WORKSPACE_ID=$(az monitor log-analytics workspace show -n $WORKSPACE -g $RESOURCE_GROUP --query id -o tsv) WORKSPACE_CUSTOMER_ID=$(az monitor log-analytics workspace show -n $WORKSPACE -g $RESOURCE_GROUP --query customerId -o tsv) WORKSPACE_KEY=$(az monitor log-analytics workspace get-shared-keys -n $WORKSPACE -g $RESOURCE_GROUP --query primarySharedKey -o tsv) az containerapp env update \ --name $ACA_ENVIRONMENT \ --resource-group $RESOURCE_GROUP \ --logs-destination log-analytics \ --logs-workspace-id $WORKSPACE_CUSTOMER_ID \ --logs-workspace-key $WORKSPACE_KEY -
Verify that monitoring data is available in your Log Analytics workspace. In your web browser, go to the Azure portal and then to your Container Apps instance. On the left pane, under Monitoring, select
Logs.From here, you can inspect the monitoring data generated by your app. To review the data in this log table, double-click
ContainerAppConsoleLogs_CLorContainerAppSystemLogs_CLand then selectRun.From this query screen, you can enter custom Kusto queries and then select
Run.For example, to get a list of all app logs, use the following query:
ContainerAppConsoleLogs_CL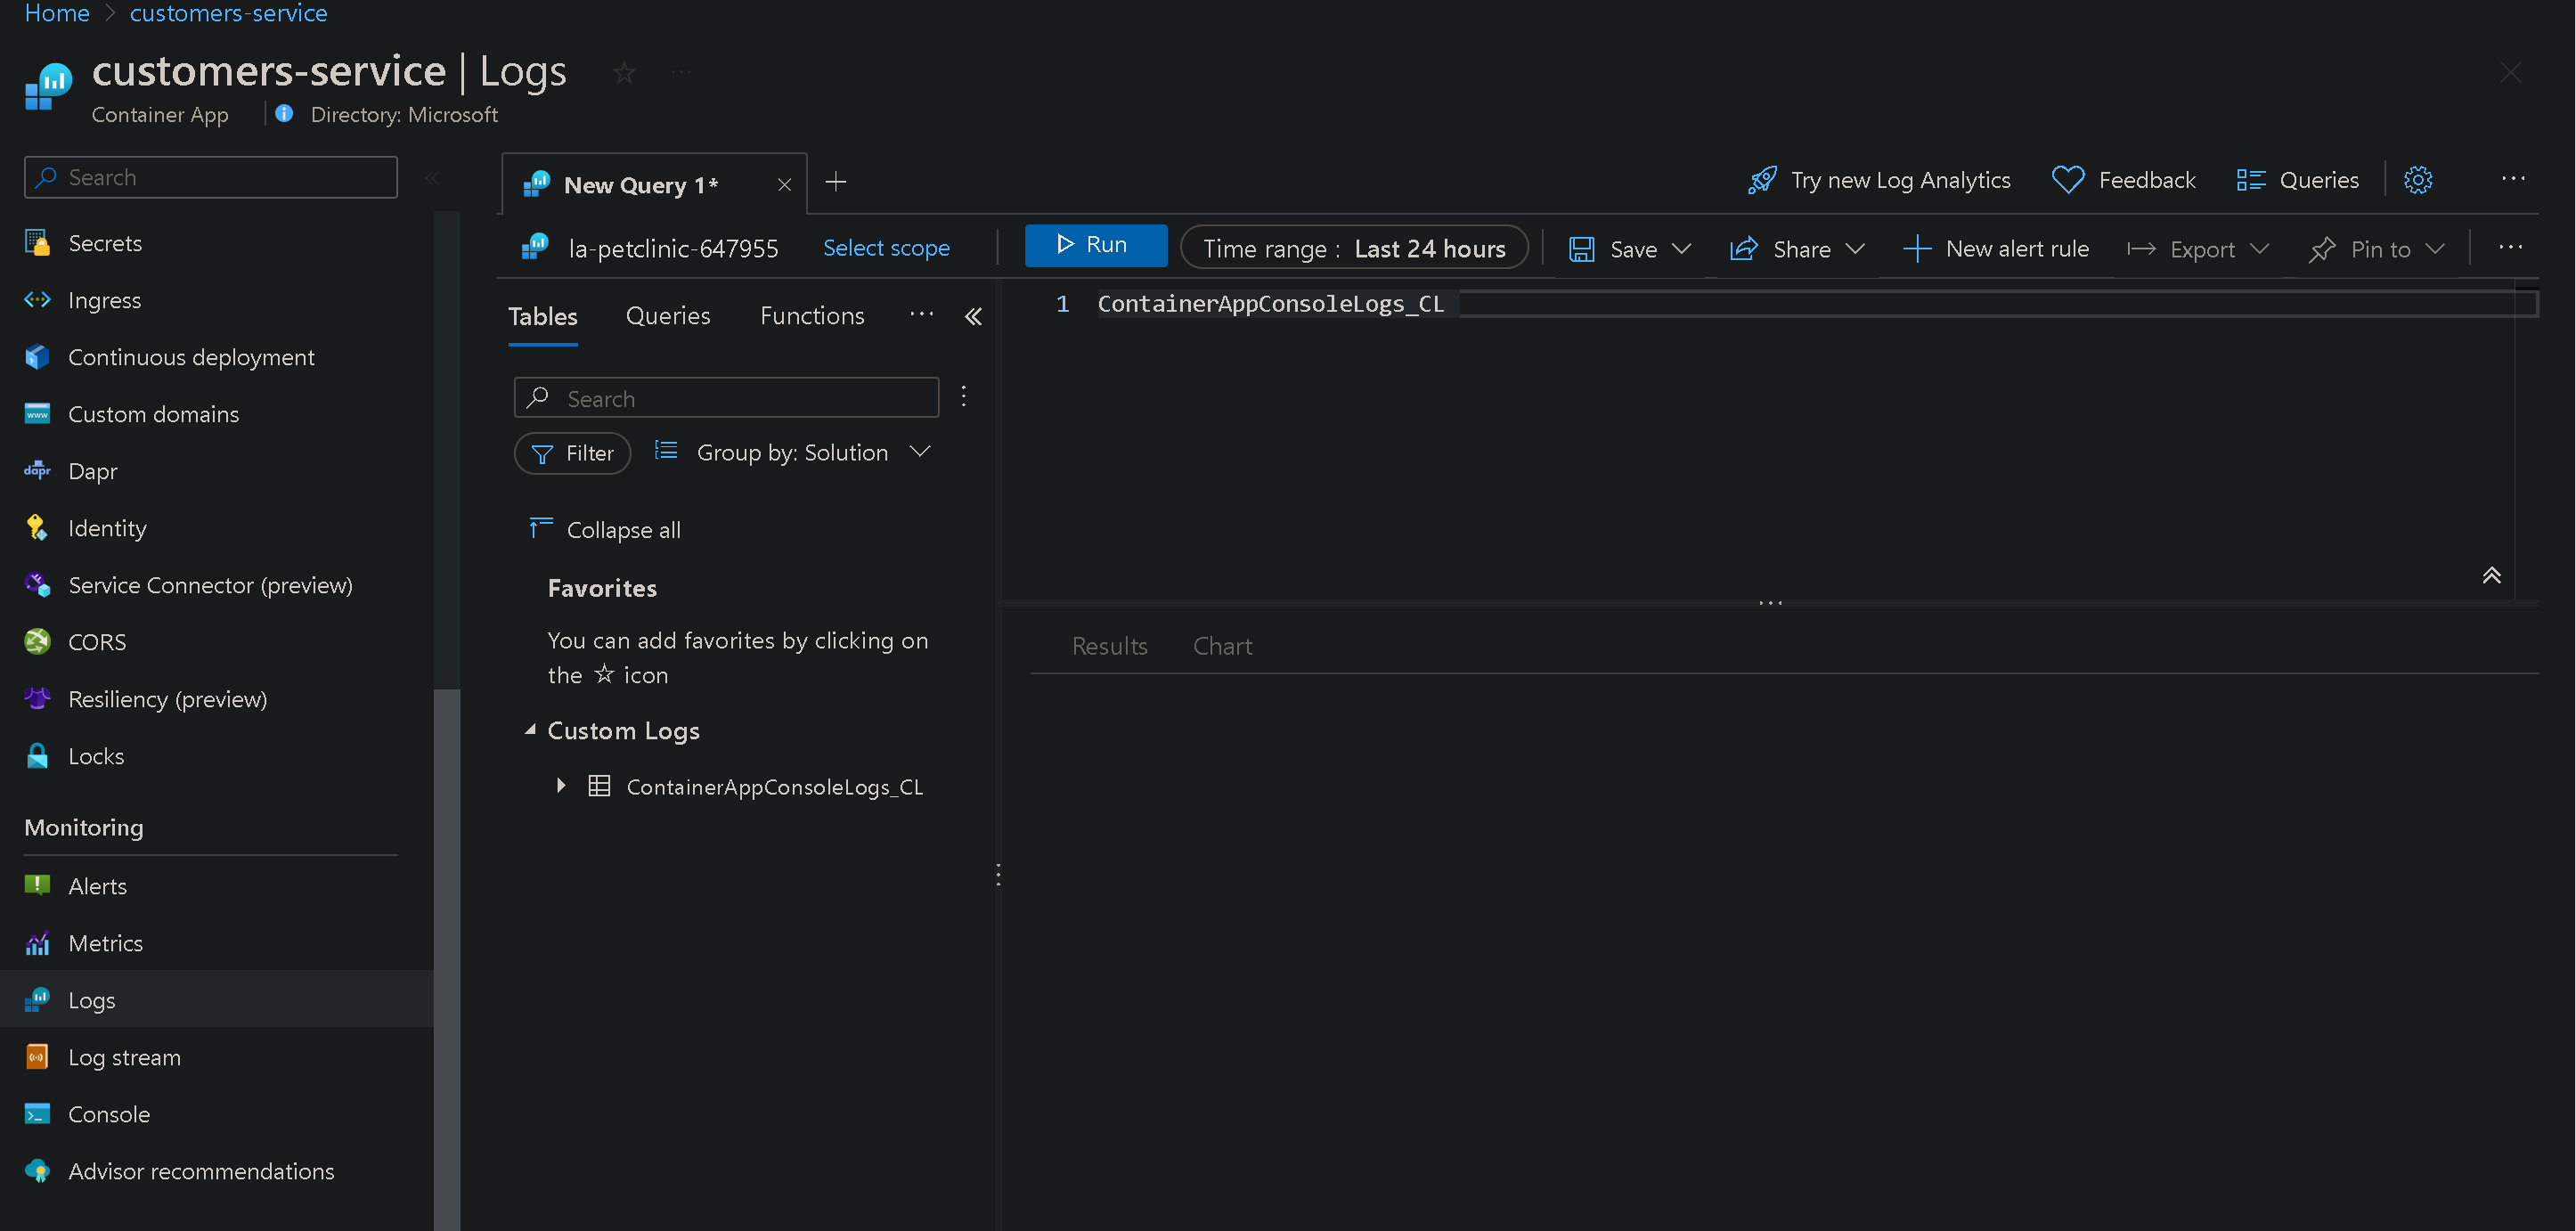
To get logs for a specific app, use this query:
ContainerAppConsoleLogs_CL
| where ContainerAppName_s == 'your-container-app-name'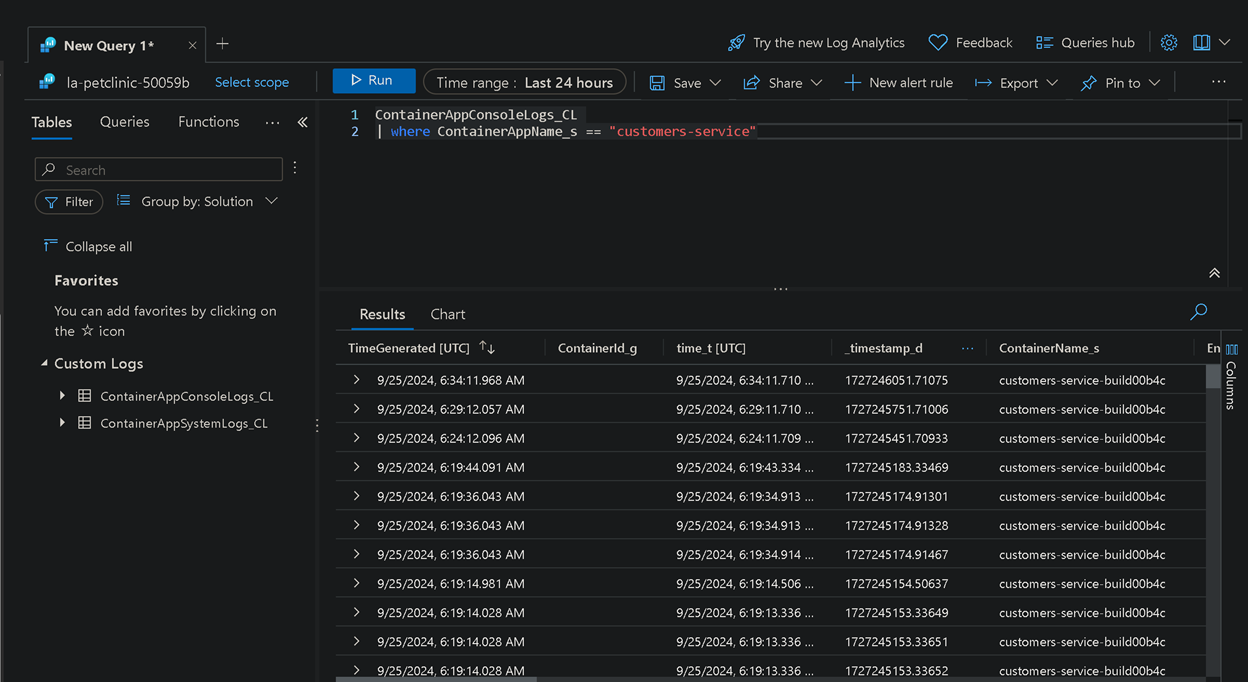
To get logs for the Eureka Server (discovery service), use this query:
ContainerAppSystemLogs_CL
| where ComponentType_s == "SpringCloudEureka"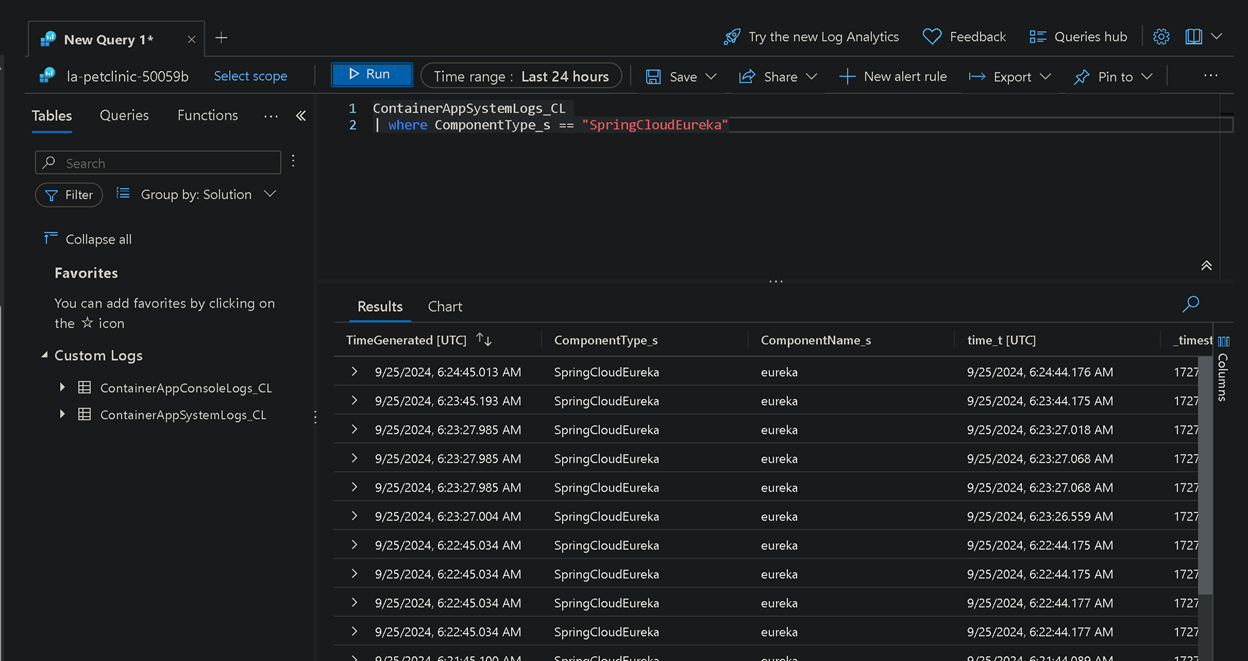
To get logs for Spring Cloud Config Server, use this query:
ContainerAppSystemLogs_CL
| where ComponentType_s == "SpringCloudConfig"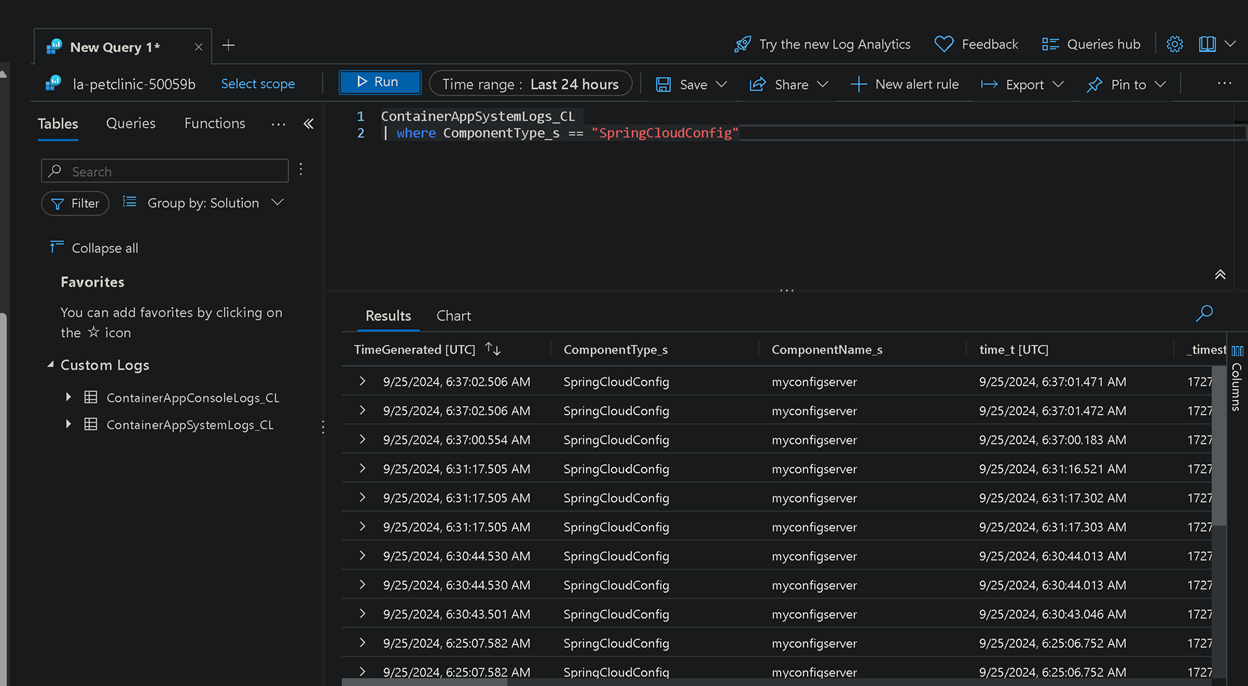
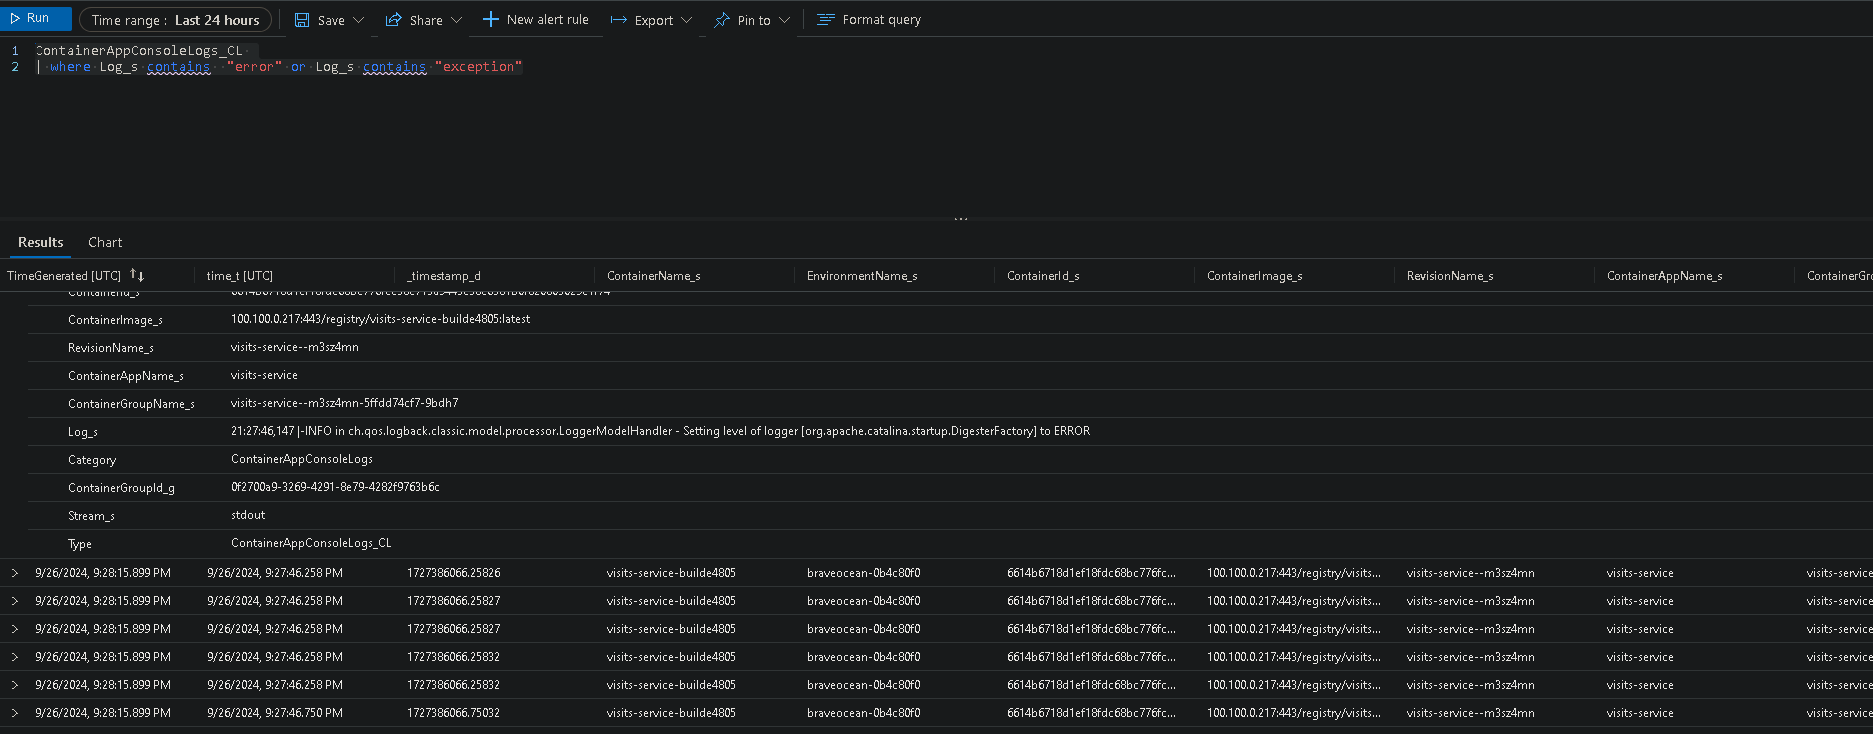
The following query string returns errors and exceptions thrown by any of your applications:
ContainerAppConsoleLogs_CL
| where Log_s contains  "error" or Log_s contains "exception"