Keep visibility into AI consumption with model monitoring
In this lesson we will use the Azure service, Azure API Management and show how by adding one of its policies to an LLM endpoint; you can monitor the usage of tokens.
Scenario: Monitor your token consumption
Monitor your token consumption is important for many reasons:
- Cost, by seeing how much you spend, you will be able to take decisions to reduce it.
- Fairness. You want to ensure your apps gets a fair amount of token. This also leads to a better user experience as the end user will be able to get a response when they expect.
Video
How to approach it?
- Create an App Insights instance.
- Import an Azure Open AI instance as an API to your Azure API Management instance.
- Configure your Azure API Management API and its policy
Exercise: Import Azure Open AI as API
Make sure you have completed the lesson on setting up cloud resources before continuing.
-
In the Azure portal, navigate to your API Management instance.
-
In the left menu, under APIs, select APIs > + Add API.
-
Under Create from Azure resource, select Azure OpenAI Service.
-
On the Basics tab:
a. Select the Azure OpenAI resource that you want to import.
b. Optionally select an Azure OpenAI API version. If you don't select one, the latest production-ready REST API version is used by default. Make a note of the version you selected. You'll need it to test the API.
c. Enter a Display name and optional Description for the API, for example aoai and My Azure Open AI respectively.
-
In Base URL, append a path that your API Management instance uses to access the Azure OpenAI API endpoints. If you enable Ensure OpenAI SDK compatibility (recommended), /openai is automatically appended to the base URL.
For example, if your API Management gateway endpoint is https://contoso.azure-api.net, set a Base URL similar to https://contoso.azure-api.net/my-openai-api/openai.
-
Optionally select one or more products to associate with the API. Select Next.
-
On the Policies tab, optionally enable policies to monitor and manage Azure OpenAI API token consumption. You can also set or edit policies later.
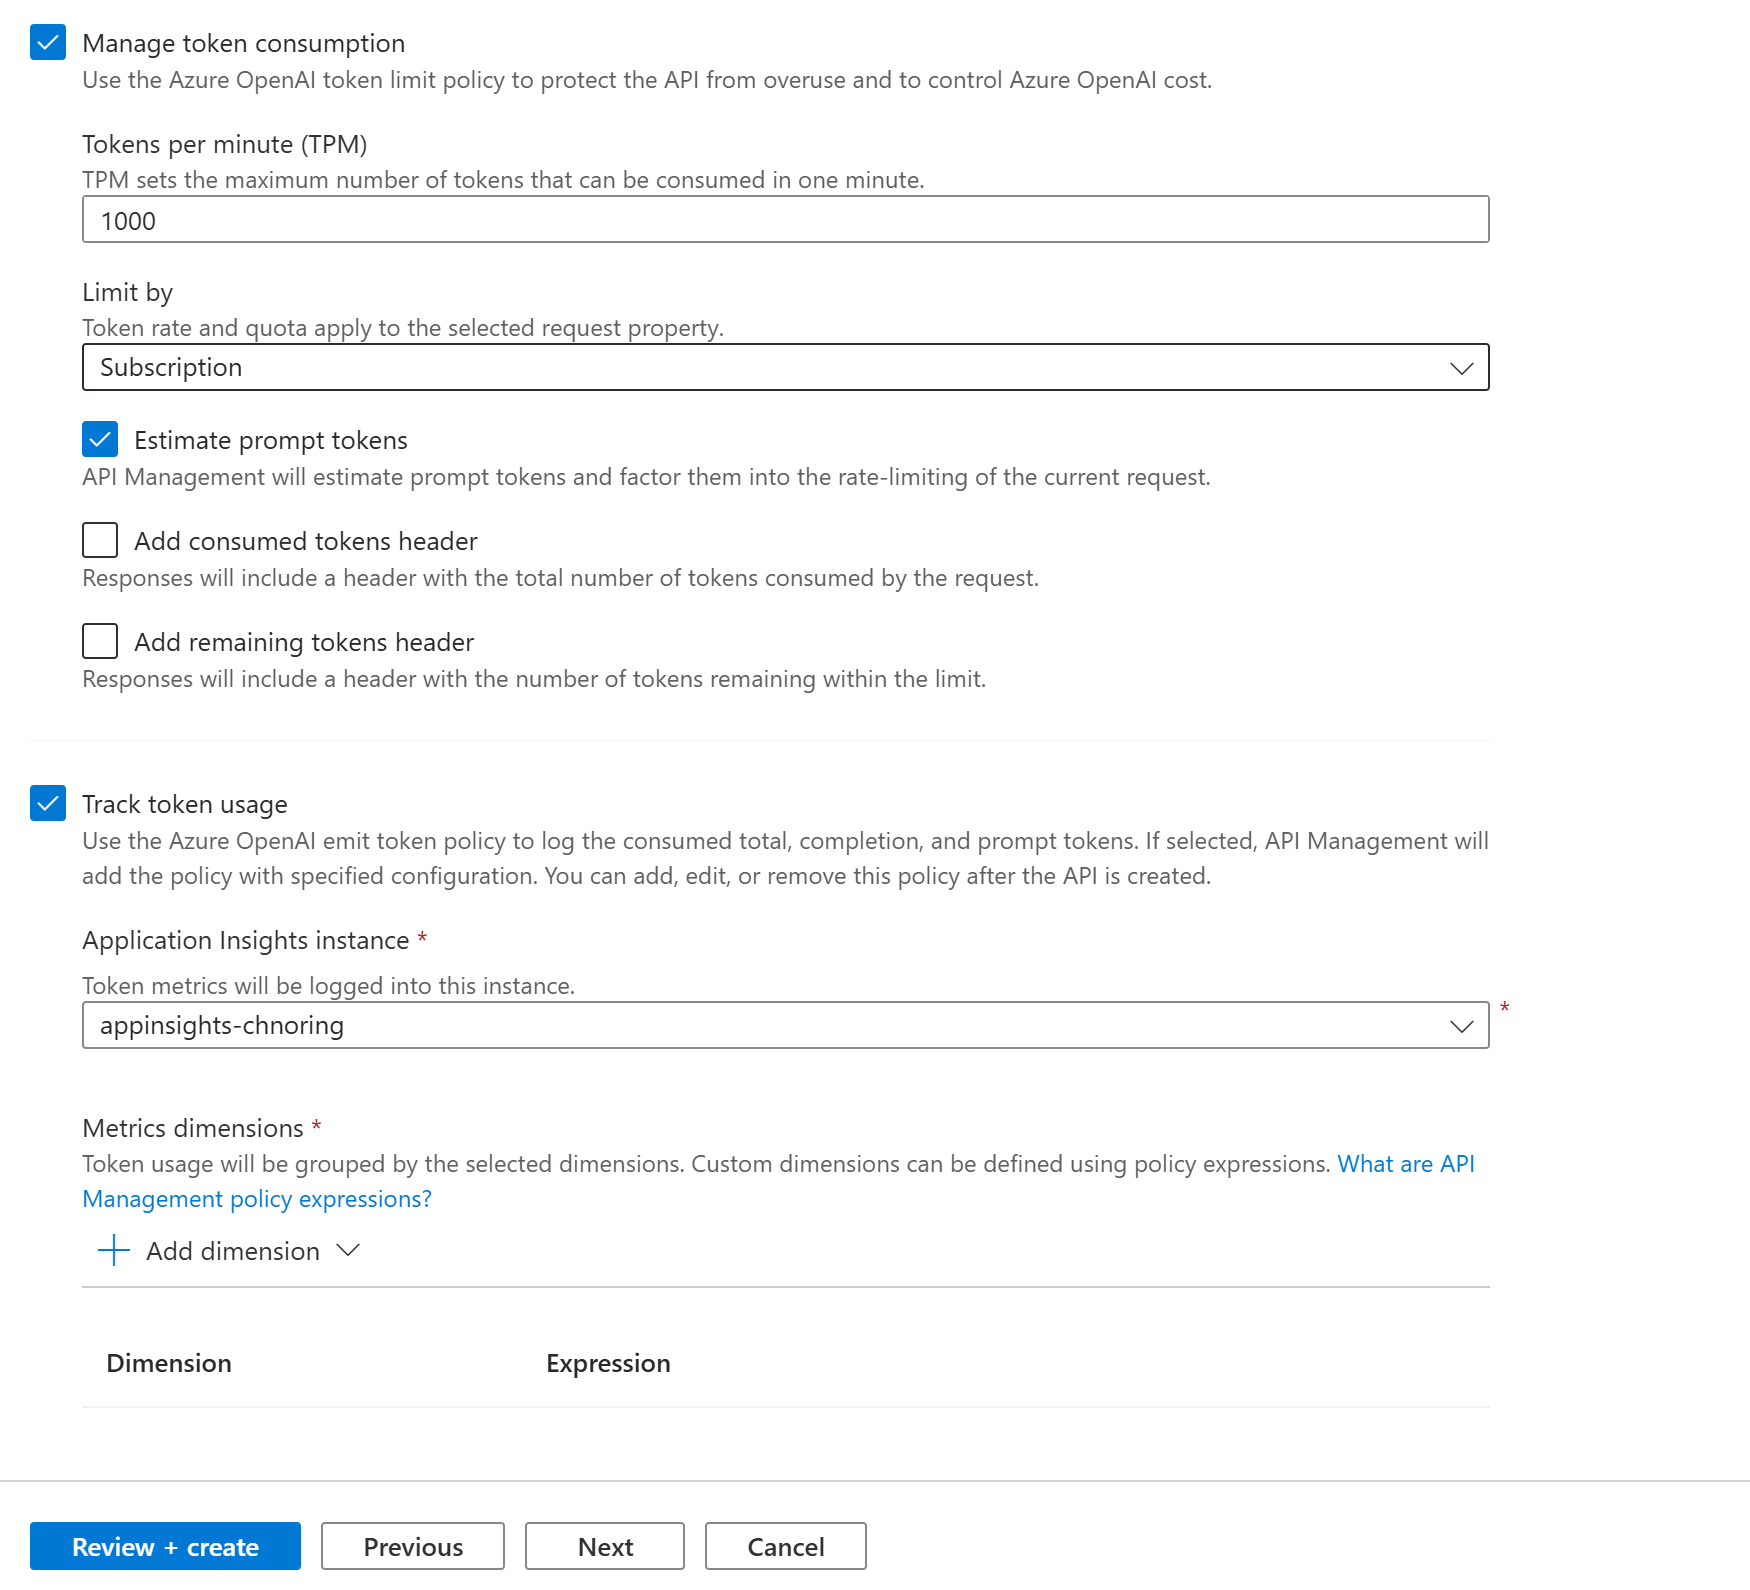
If selected, enter settings or accept defaults that define the following policies (see linked articles for prerequisites and configuration details):
- Manage token consumption
- Track token usage
-
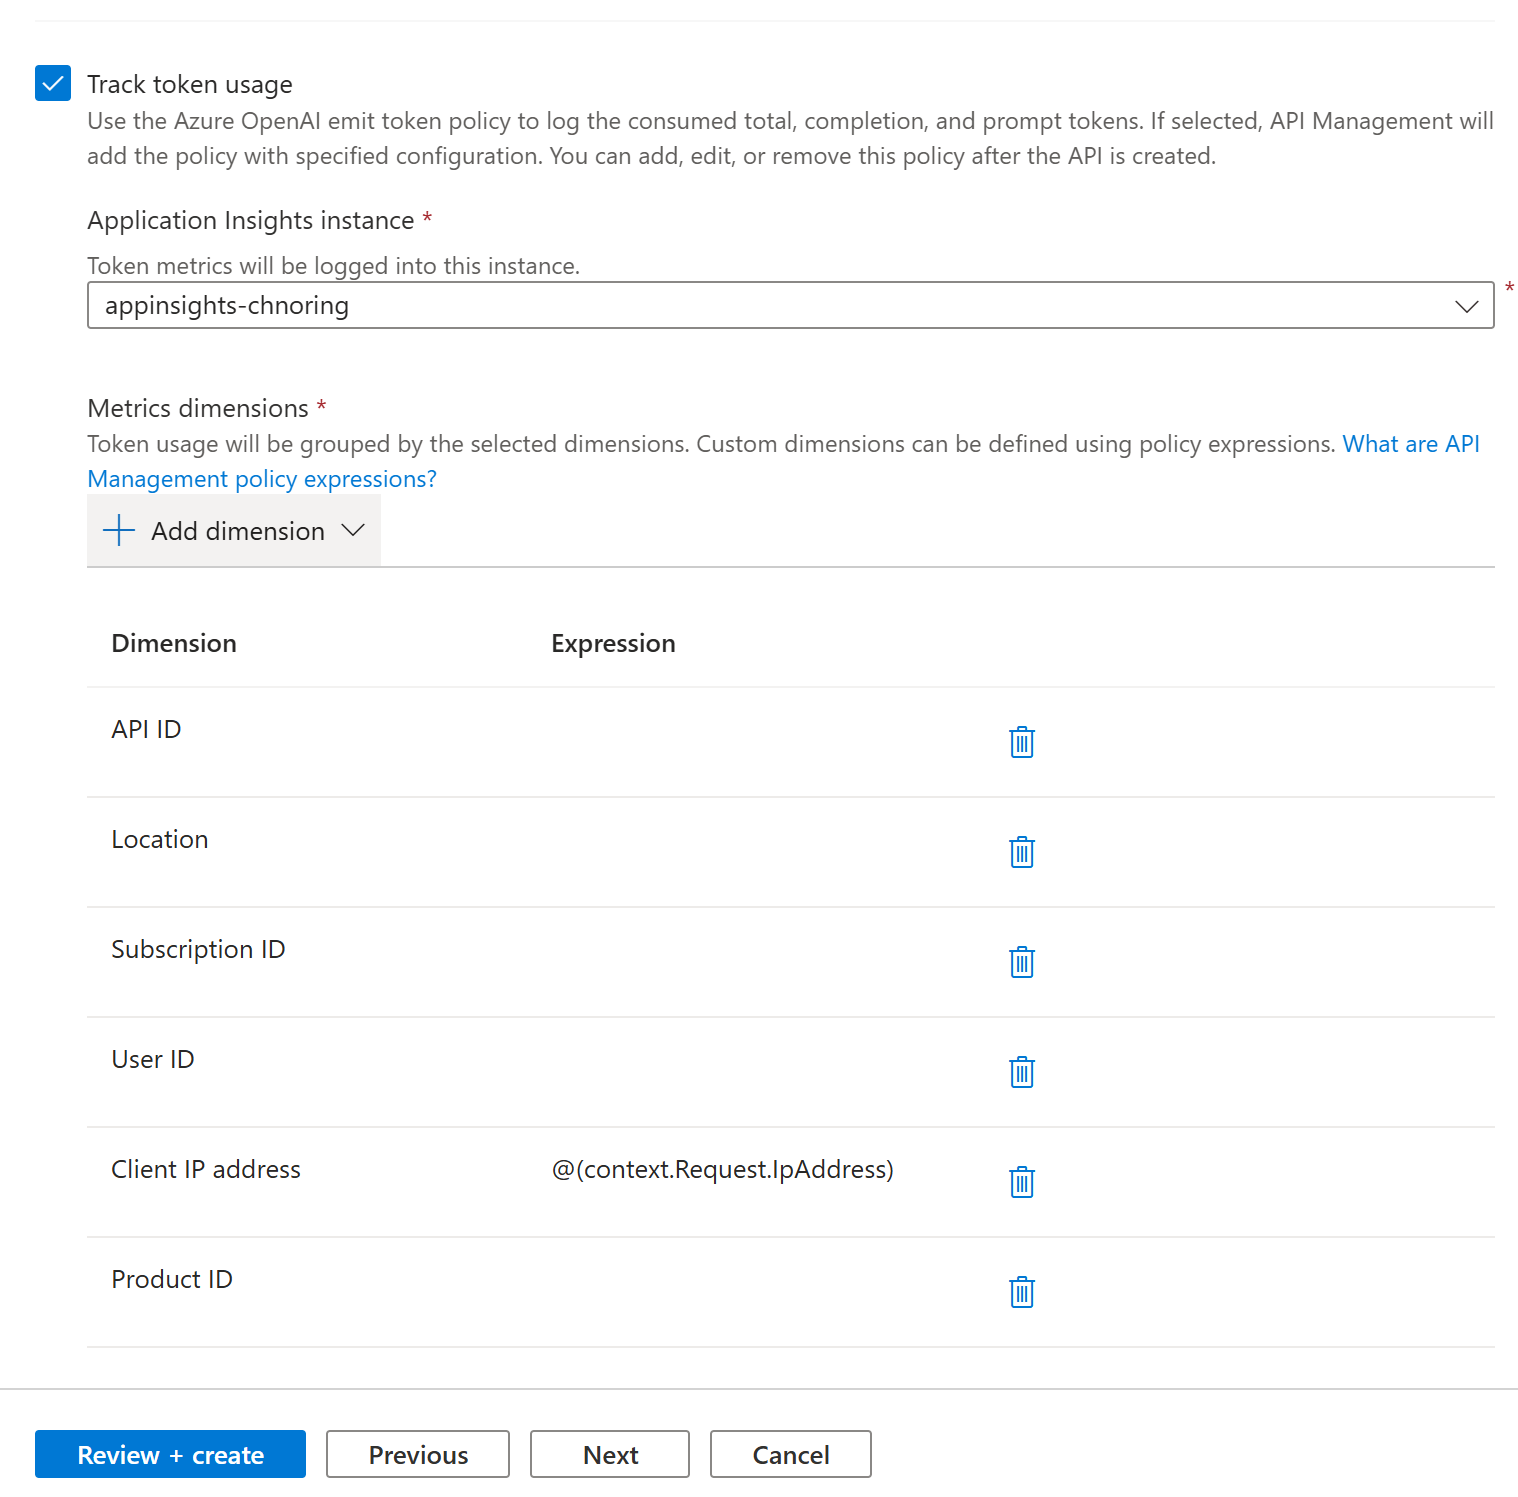
Add dimensions you want to track, you can also do this at a later stage. Here's how you can add dimensions:
-
Select Review + Create.
-
After settings are validated, select Create.
Great, now the import is complete, let's test out our API.
-1- Enable monitoring on the API
Now that we have imported our Azure Open AI instance, let's inspect what we got and test the API to make sure everything works.
-
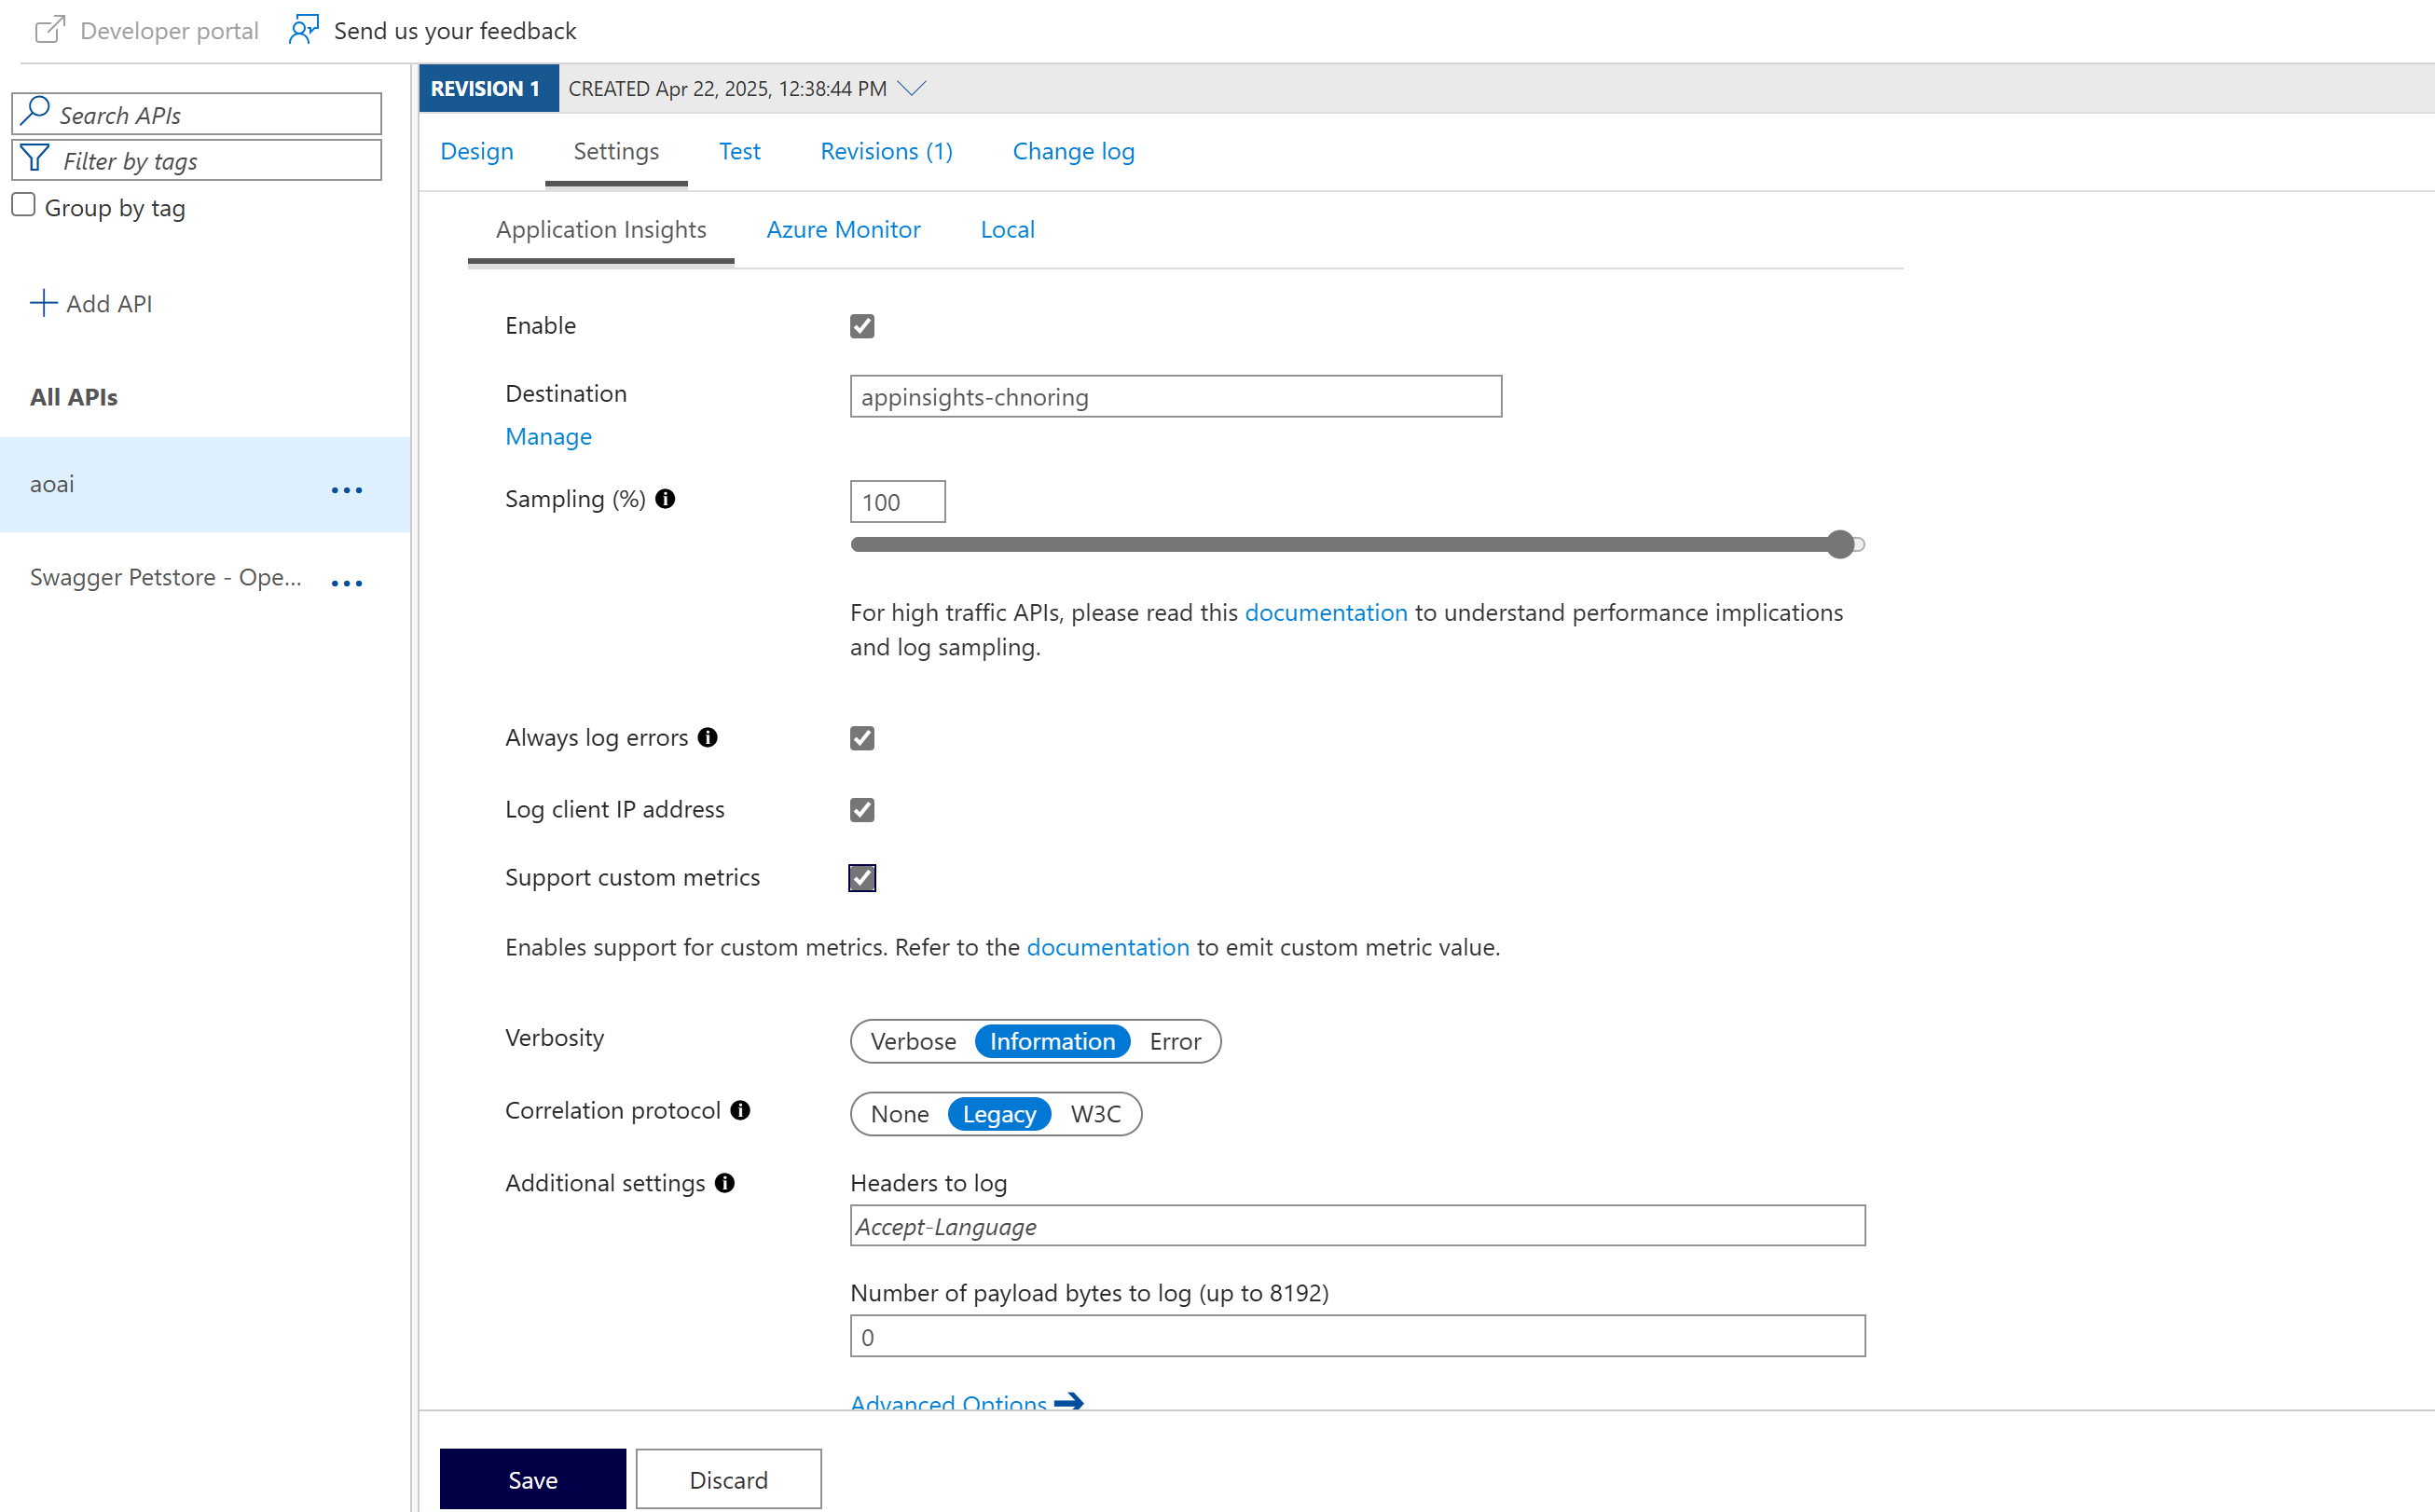
Select your API aoai and select the Settings tab
-
Check enable checkbox and leave the rest as is.
-
Select Save
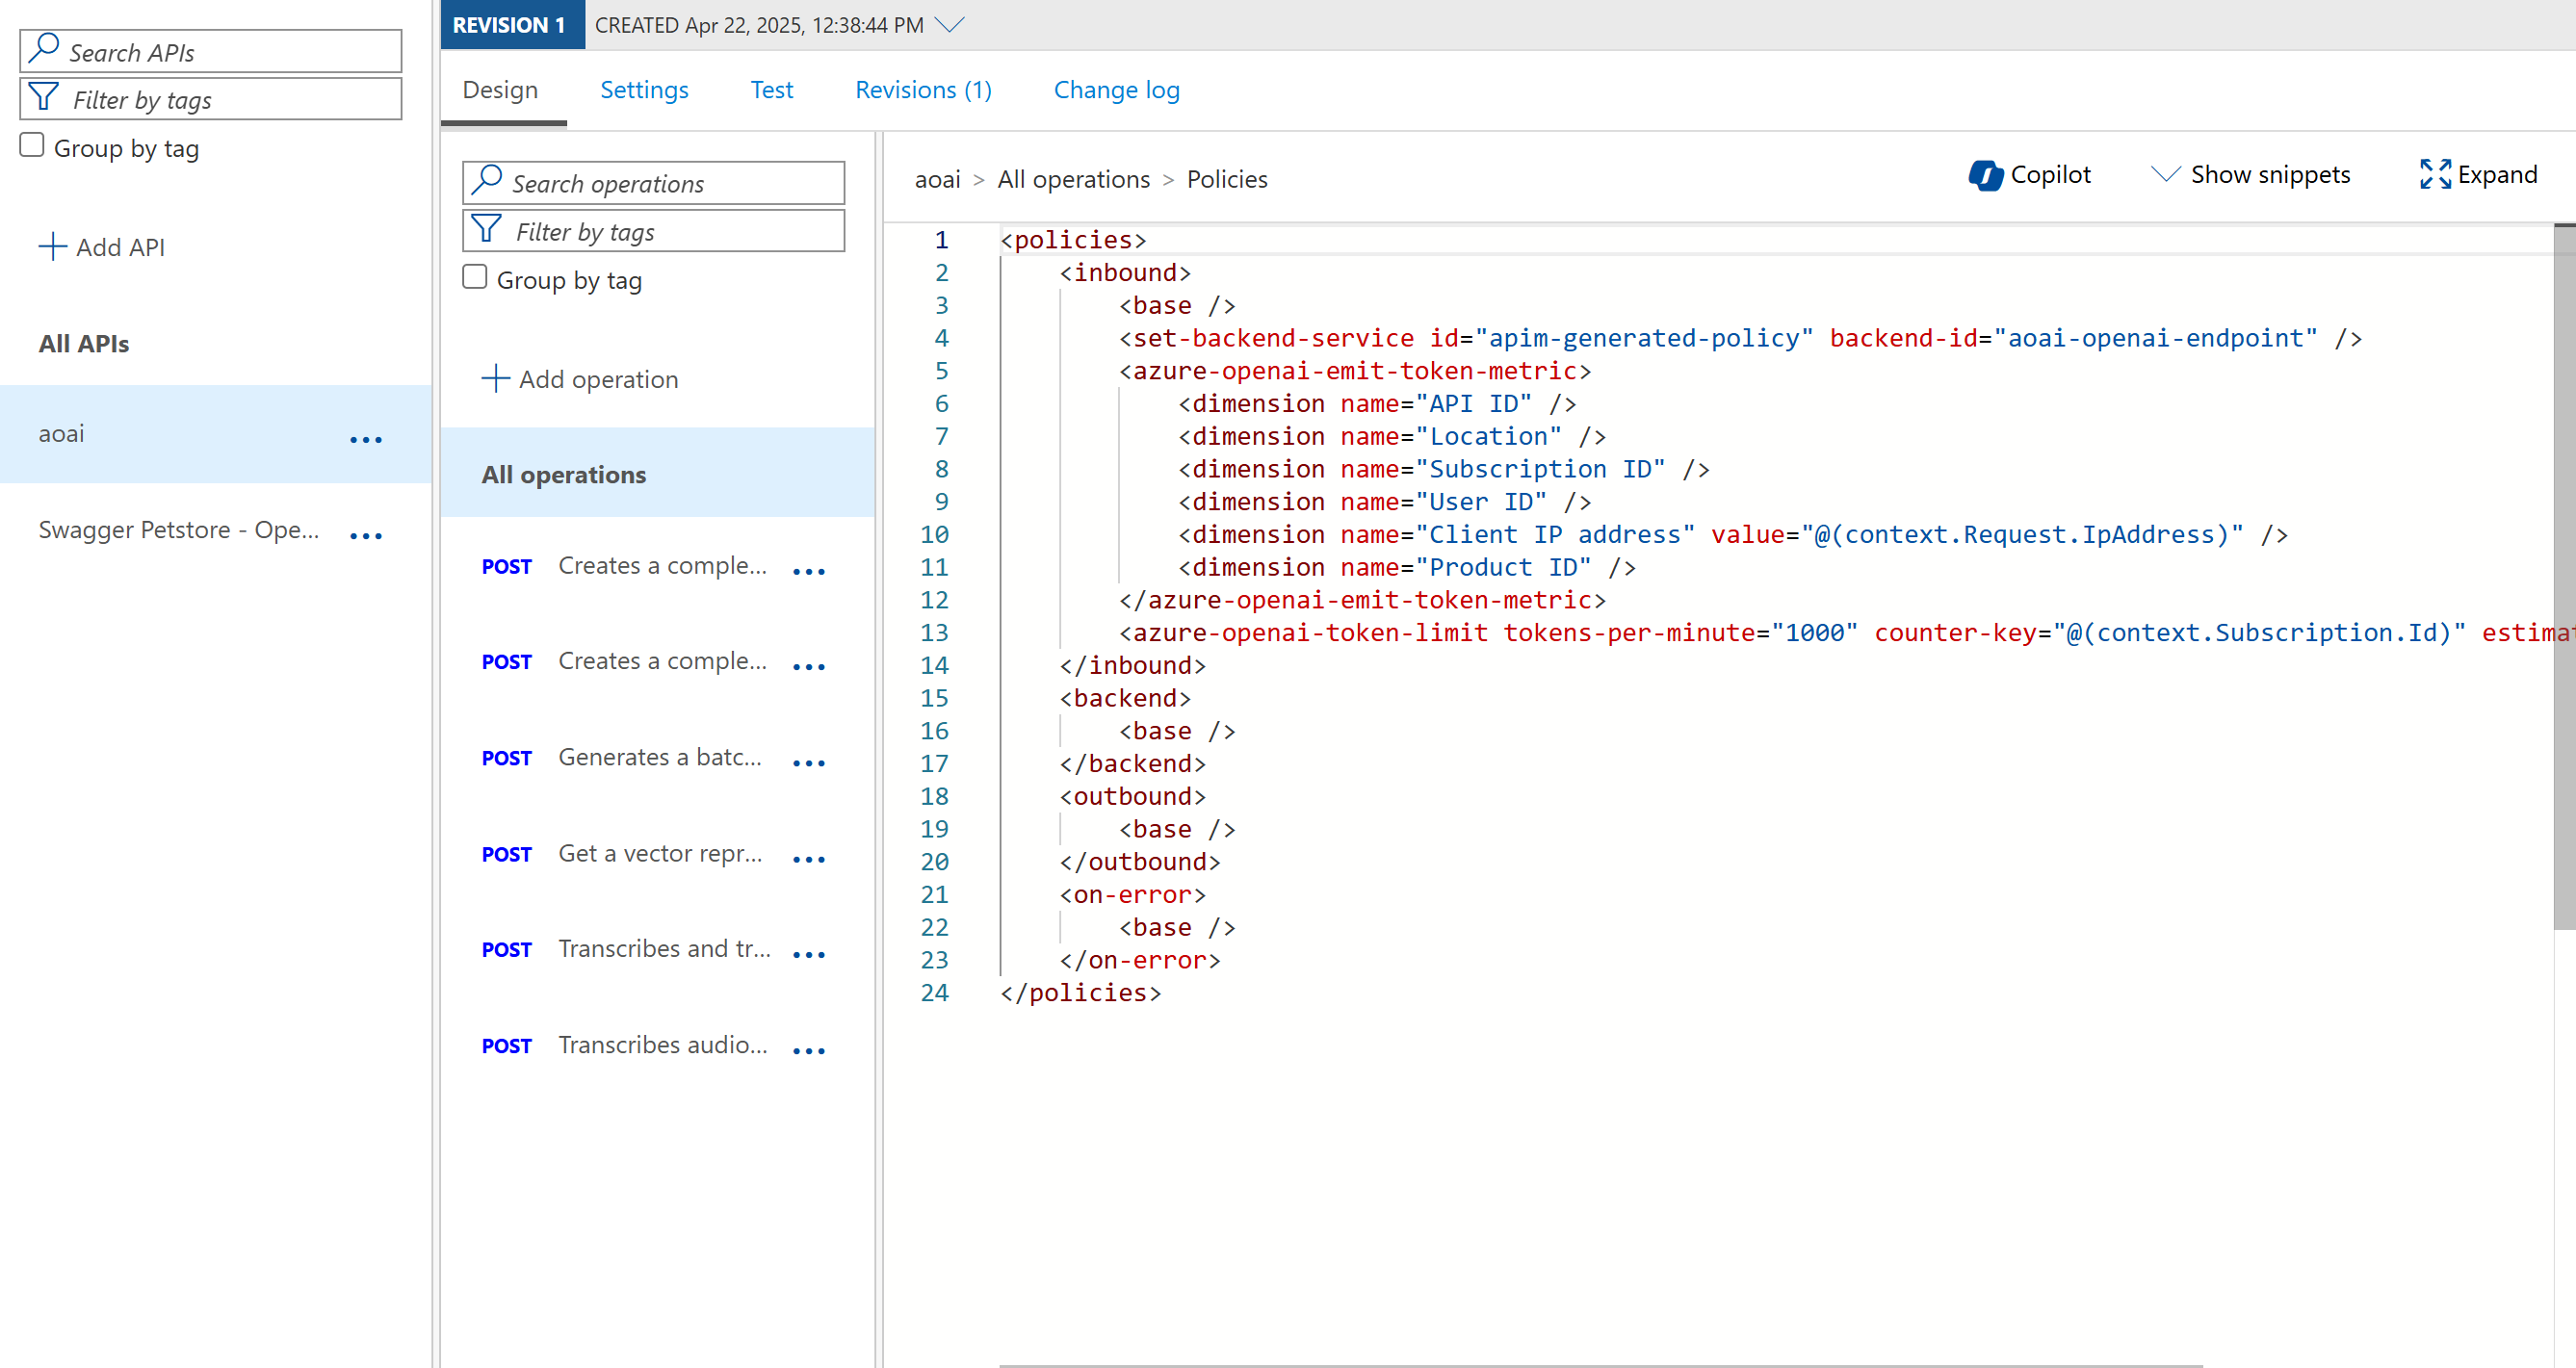
-2- Inspect the API and policy on the API
-
Select Design tab.
You should see a policy and all the dimensions you've select during import. You can add further dimensions if you wish.
-
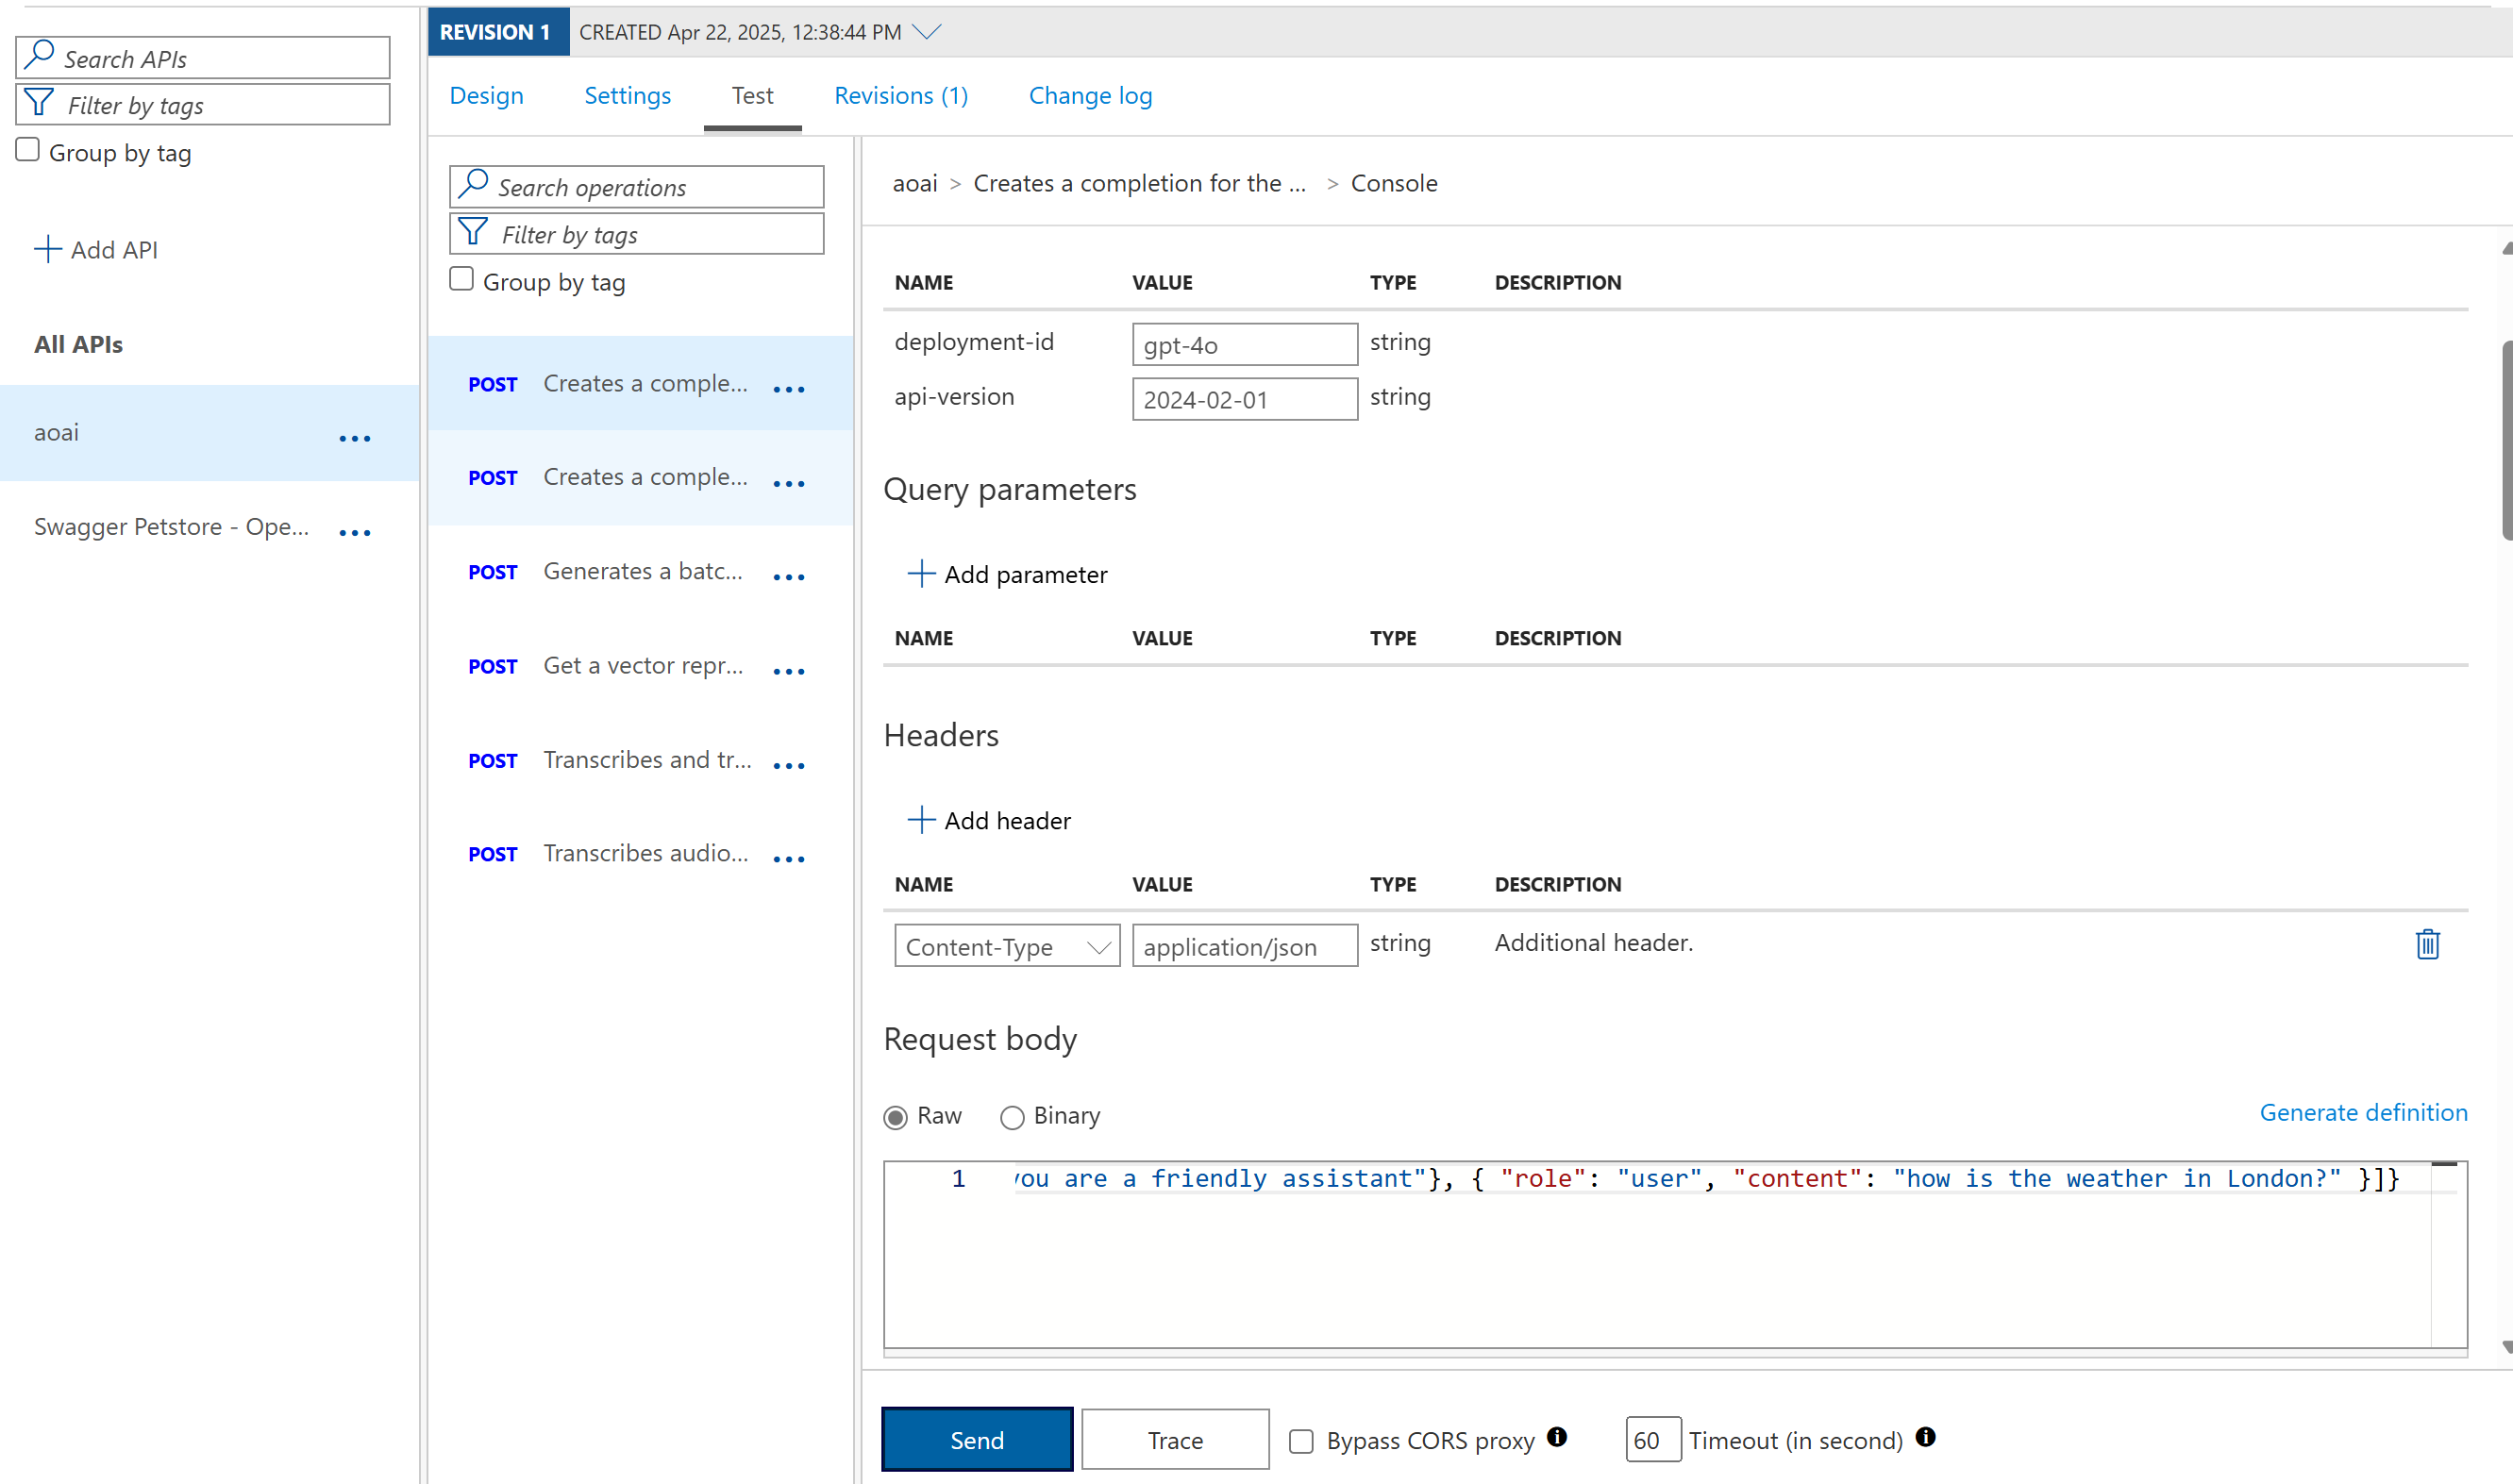
Let's test the API by navigating to Test tab.
-
Fill in the following values:
Settings Value Description deployment-id gpt-4o your deployment ID, double check the name in Azure AI Foundry api version 2024-02-01 a supported schema request body {"messages":[{"role":"system", "content": "you are a friendly assistant"}, { "role": "user", "content": "how is the weather in London?" }]}a JSON request body that contains messages for the AI model. -
Select Send, you should see a request response coming back.
Exercise: Test monitoring
To test the monitoring, we need to run a few requests, then navigate to it and inspect it.
- Run a few requests by going to your API, select the "Test" tab and fill in values for:
| Field | Value |
|---|---|
| Deployment Id | gpt-4o |
| API Version | 2024-02-01 |
| Request body | {"messages":[{"role":"system", "content": "you are a friendly assistant"}, { "role": "user", "content": "how is the weather in London?" }]} |
-
In the menu, select Monitoring / Application Insights / Select your instance
That should take you to your application insights resource.
-
Select Monitoring / Metrics
That takes you to your dashboard.
-
In Metrics namespace droplist, select api management, like so:
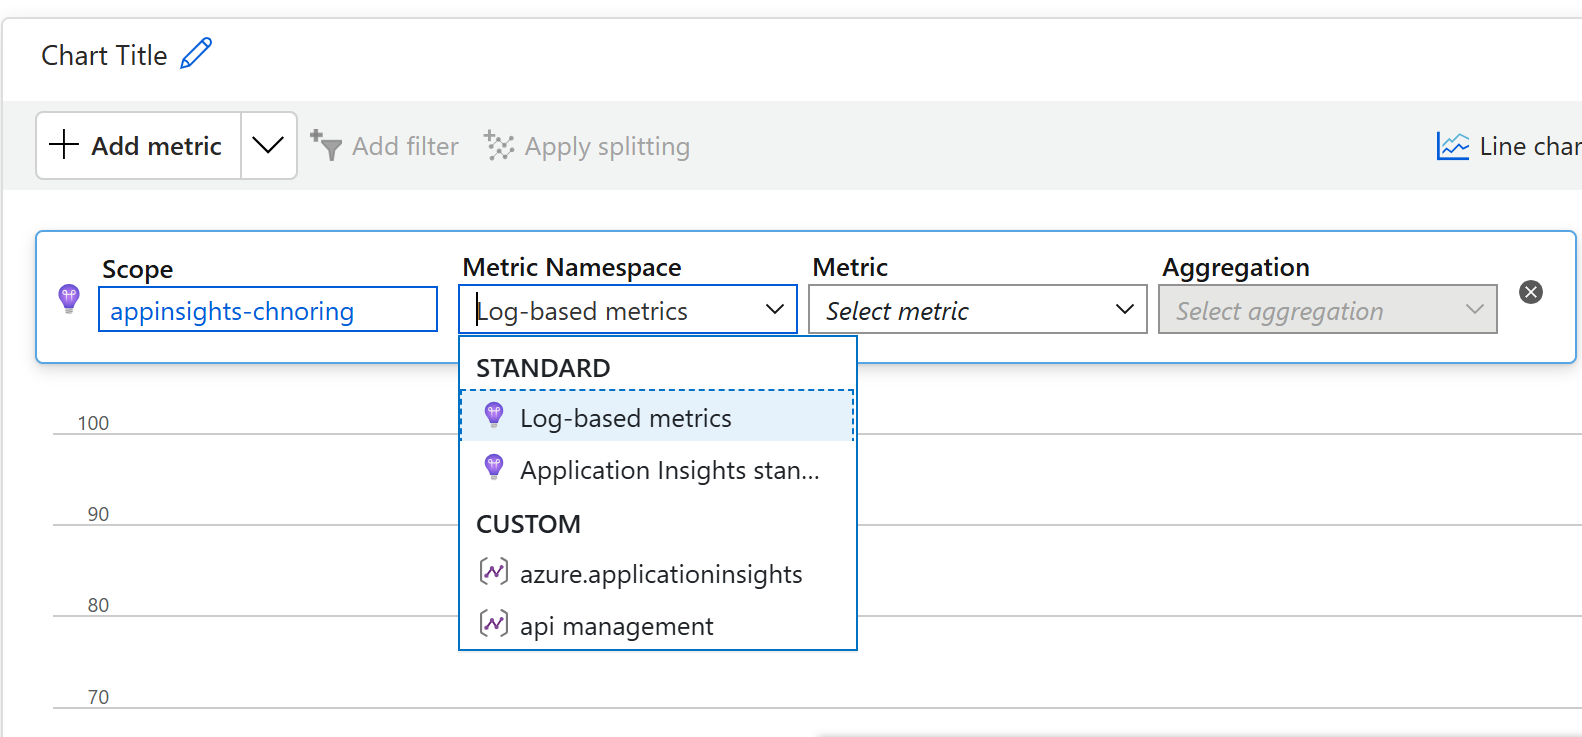
Once you select that, Metrics droplist should filter down to some very interesting metrics like Completion Tokens, Prompt Tokens and Total Tokens.
-
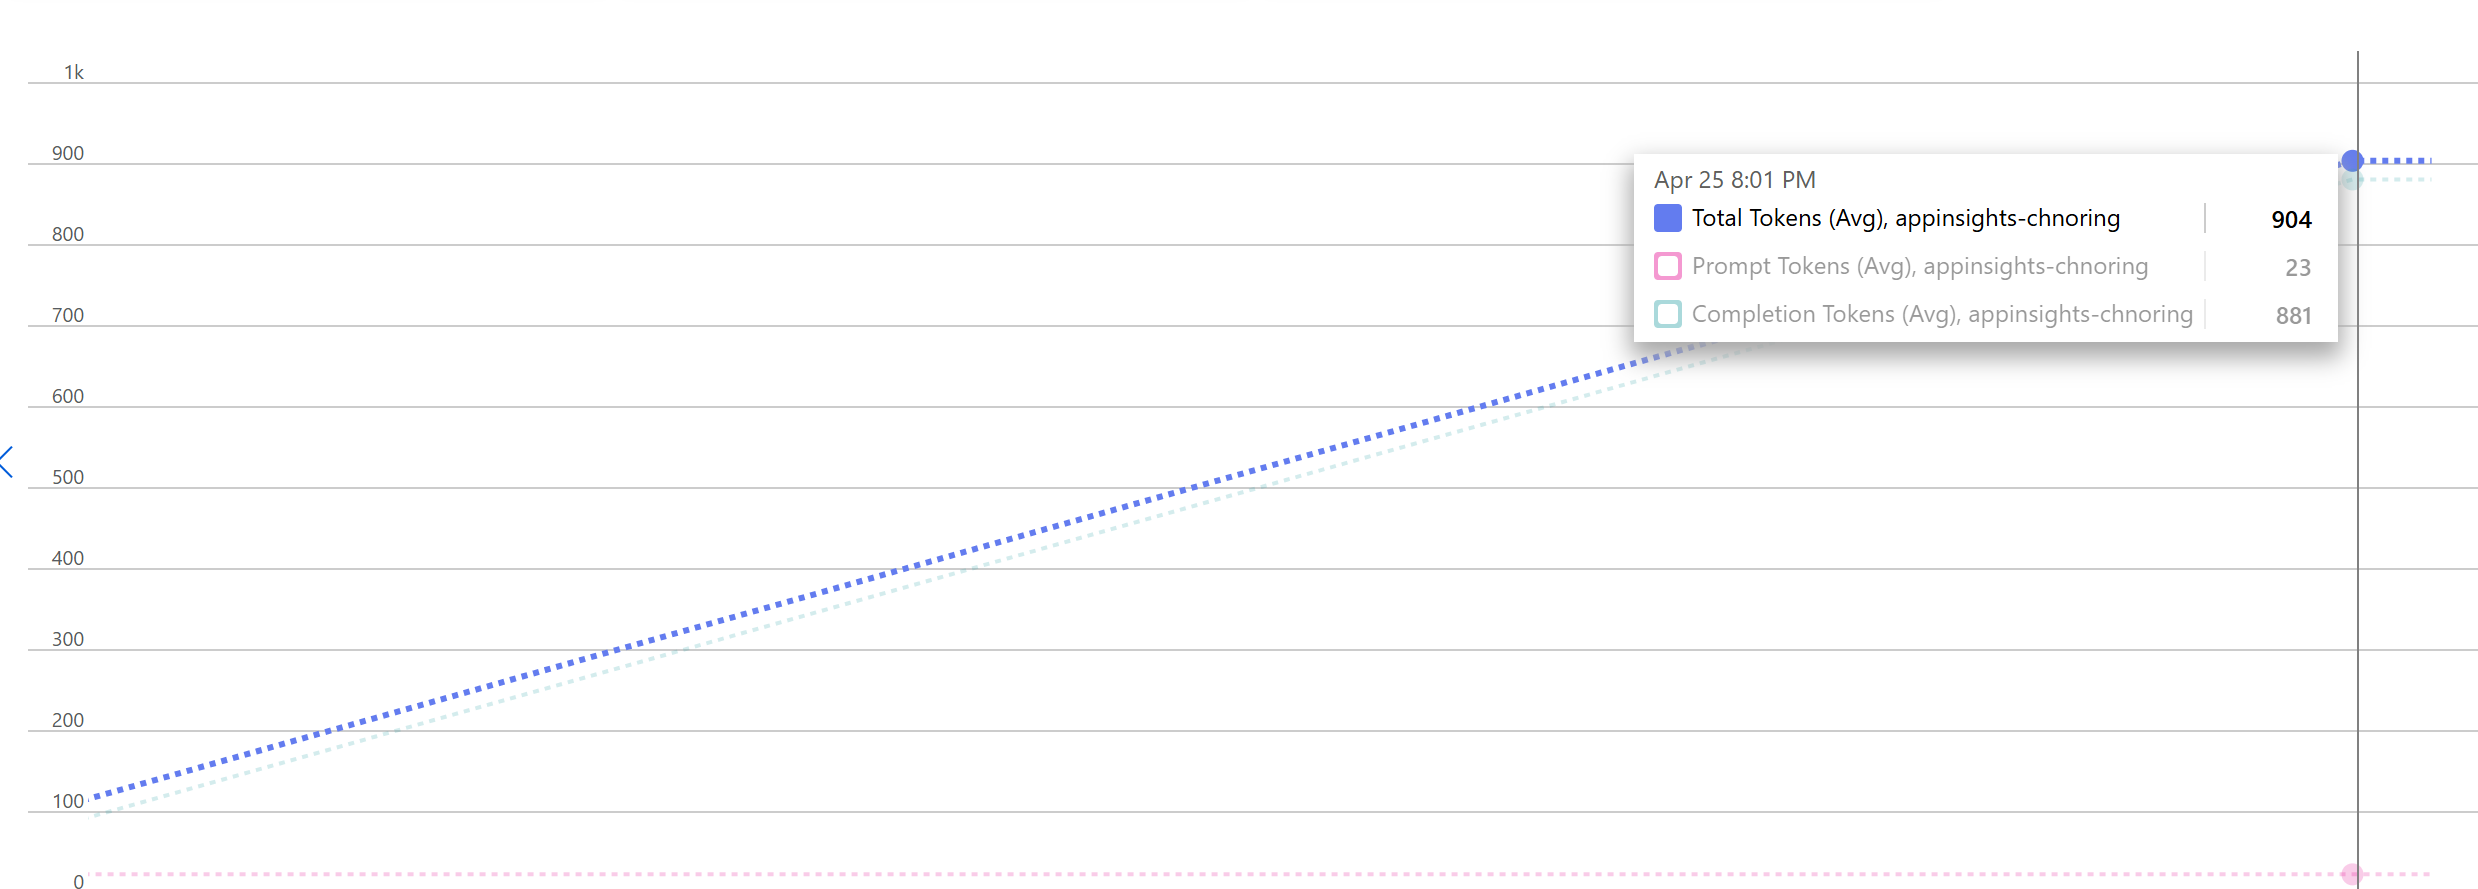
Add all three metrics and you should see something similar to below image:
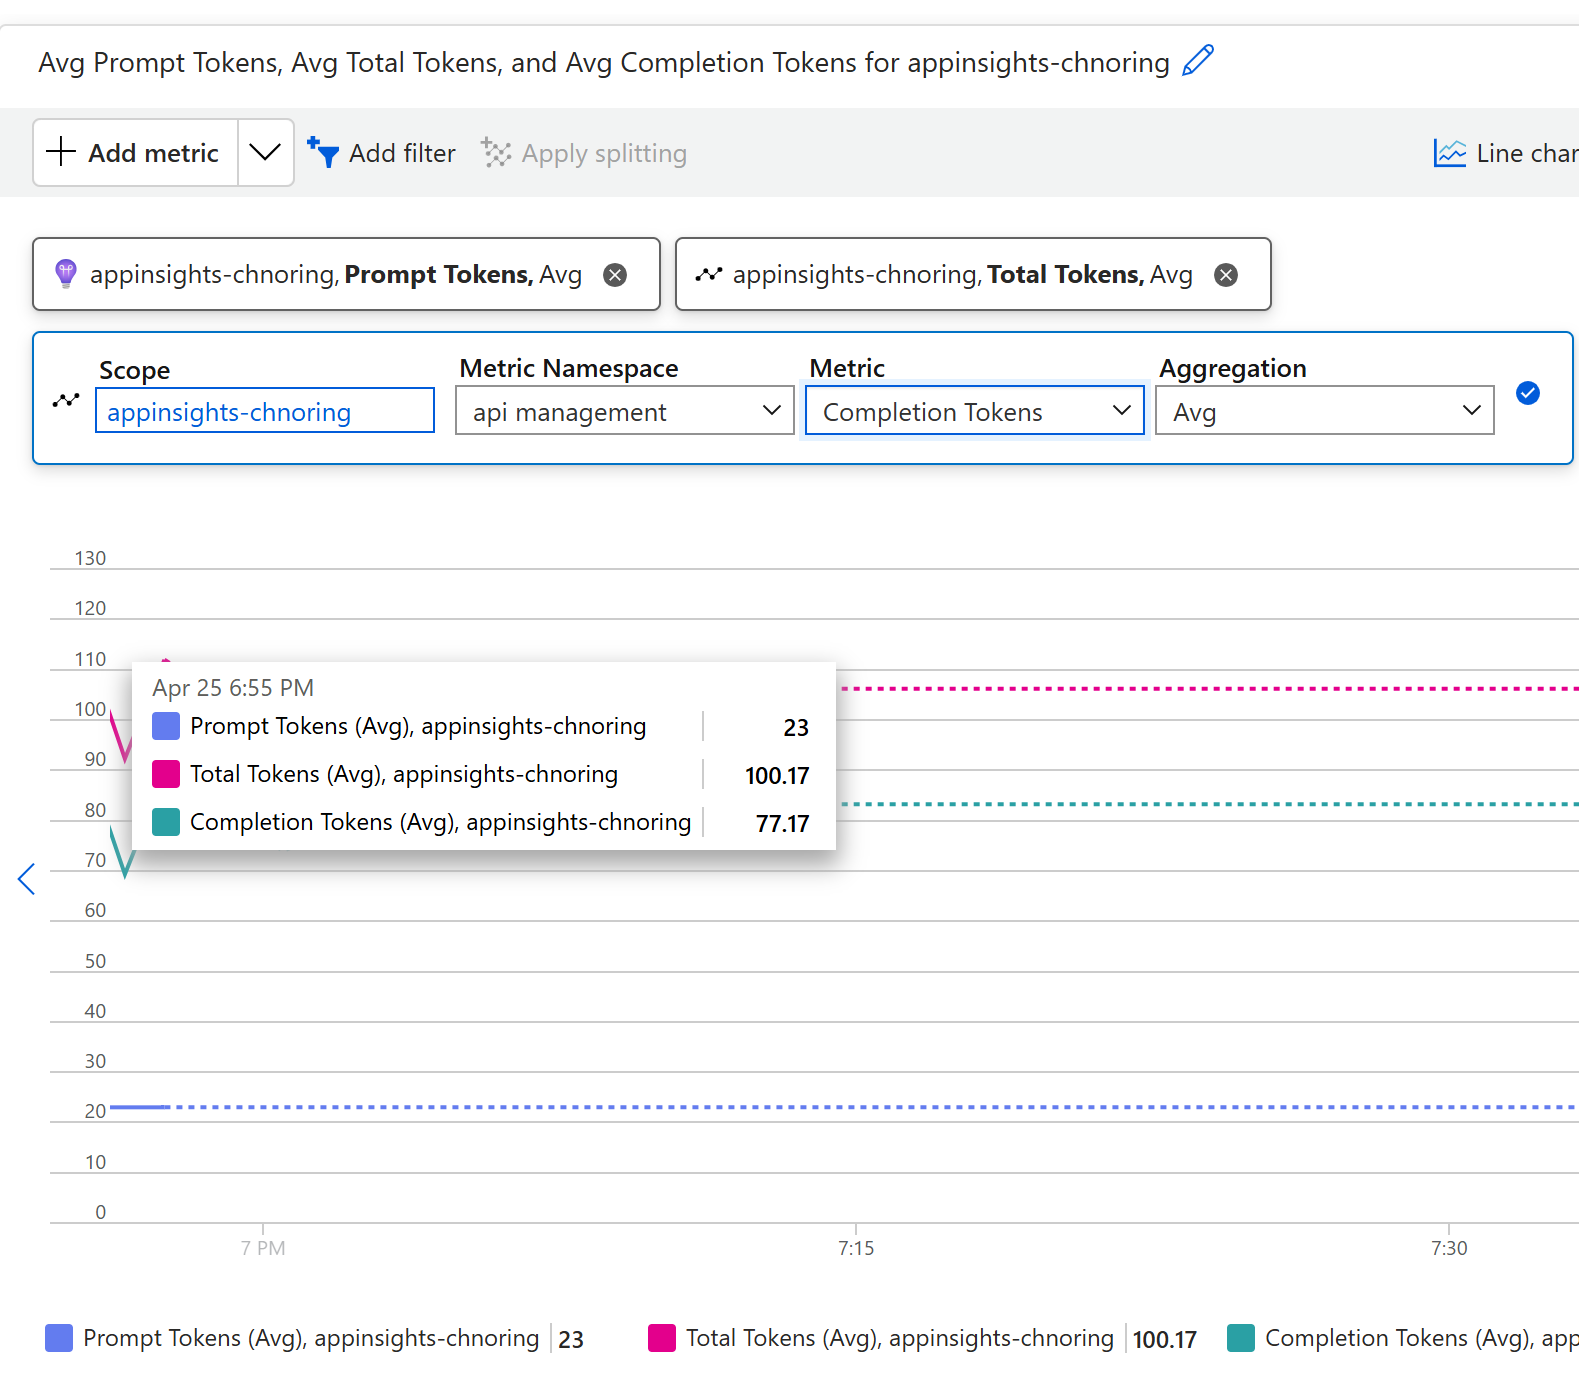
Now you can see your prompts token (23), the number of tokens used to present a response (77.17) and the total number of tokens (100.17)
If you want, try to test some more requests with different prompts and see how they show up on the dashboard. Below here's what it can look like with a new request, note how both the second smaller request (to the left in the screen) is present and the new request (to the right in the screen)
Additional Resources
- Docs: Emit token metric policy
- Docs: Set up Azure Monitor