Advanced Observability Concepts
Advanced Observability Concepts
Overview
As a Kubernetes practitioner, you're probably familiar with managing your own Prometheus and Grafana stack for observability. With Azure Managed Prometheus and Azure Managed Grafana, you can now leverage those same cloud-native tools—without the operational burden of deploying, scaling, and securing them yourself. These managed services integrate natively with AKS and support standard Prometheus APIs and Grafana dashboards, making adoption seamless.
Objectives
-
Enable and Visualize Control Plane Metrics: Gain hands-on experience enabling AKS control plane metrics (e.g., kube-apiserver, etcd) and visualizing them using pre-built dashboards in Azure Managed Grafana.
-
Customize Metric Collection: Learn how to extend observability by customizing metric collection through
ConfigMapsand enabling additional Prometheus metrics. -
Implement Custom Scrape Jobs: Deploy and configure custom scrape jobs using
PodMonitorandServiceMonitorCRDs to collect application-specific metrics in Azure Managed Prometheus.
Prerequisites
- An Azure Subscription
- Azure CLI version 2.60.0 or later
aks-preview- see note below- kubectl version 1.28.9 or later
- A terminal with
bash(e.g.: Windows Terminal with WSL or Azure Cloud Shell
To install or update the aks-preview extension you can use the following commands:
# Install the aks-preview extension
az extension add --name aks-preview

# Update the aks-preview extension
az extension update --name aks-preview
AKS control plane metrics
As you may know, Kubernetes control plane components are managed by Azure and there are metrics that Kubernetes administrators would like to monitor such as kube-apiserver, kube-scheduler, kube-controller-manager, and etcd. These are metrics that typically were not exposed to AKS users... until now.
AKS now offers a preview feature that allows you to access these metrics and visualize them in Azure Managed Grafana. More on this preview feature can be found here.
Before enabling this preview, review the prerequisites and limitations of this feature while it is in preview.
To enable the feature:
- Register the
AzureMonitorMetricsControlPlanePreviewfeature flag using the az feature register command.
az feature register \
--namespace "Microsoft.ContainerService" \
--name "AzureMonitorMetricsControlPlanePreview"
- Once the feature is registered, refresh resource provider.
az provider register --namespace Microsoft.ContainerService
Once registered, you’ll be able to surface these metrics using prebuilt Grafana dashboards or your own visualizations—without managing your own Prometheus stack.
Setup your environment
Step 1: Define your environment variables and placeholders
In these next steps, we will setup a new AKS cluster, an Azure Managed Grafana instance and a Azure Monitor Workspace.
- Create a placeholder directory
Before we begin lets create a new directory that can be a placeholder for all of our files created during this lab:
mkdir -p aks-labs/operations/advanced-observability/
cd aks-labs/operations/advanced-observability/
- Next, proceed by declaring the following environment variables:
cat <<EOF> .envrc
export RG_NAME="rg-advanced-observability"
export LOCATION="westus3"
export RG_NAME="rg-advanced-mon"

# Azure Kubernetes Service Cluster
export AKS_CLUSTER_NAME="advanced-mon"

# Azure Managed Grafana
export GRAFANA_NAME="aks-labs-${RANDOM}"

# Azure Monitor Workspace
export AZ_MONITOR_WORKSPACE_NAME="azmon-aks-labs"
EOF
Load the environment variables:
source .envrc
Now that we have saved the environment variables, you can always reload these variables later if needed by running source .envrc on this directory.
Step 2: Create the Azure Monitor Workspace
- Create the resource group
# Create resource group
az group create --name ${RG_NAME} --location ${LOCATION}
- Create an Azure Monitor Workspace
az monitor account create \
  --resource-group ${RG_NAME} \
  --location ${LOCATION} \
  --name ${AZ_MONITOR_WORKSPACE_NAME}
The resource provider Microsoft.Monitor is required by this operation. If not already registered, by running this command, we will register this resource for you.
Retrieve the Azure Monitor Workspace ID
AZ_MONITOR_WORKSPACE_ID=$(az monitor account show \
  --resource-group ${RG_NAME} \
  --name ${AZ_MONITOR_WORKSPACE_NAME} \
  --query id -o tsv)
Step 3: Create an Azure Managed Grafana instance
In this step, we will do the following:
-
Add the Azure Managed Grafana extension to
az cli. -
Create an Azure Managed Grafana instance.
-
Save the Azure Manage Grafana Resource identity which will later be attached to the AKS cluster.
The Azure CLI extension for Azure Managed Grafana (amg) allows us to create, edit, delete the Azure Managed Grafana instance from the cli. If you can't add this extension, you can still perform these actions using the Azure Portal.
- Add the Azure Manage Grafana extension to
az cli:
az extension add --name amg
- Create an Azure Managed Grafana instance:
You can now proceed with the creation of the Managed Grafana instance:
az grafana create \
  --name ${GRAFANA_NAME} \
  --resource-group $RG_NAME \
  --location $LOCATION
- Once created, save the Grafana resource ID
GRAFANA_RESOURCE_ID=$(az grafana show \
  --name ${GRAFANA_NAME} \
  --resource-group ${RG_NAME} \
  --query id -o tsv)
Step 4: Create a new AKS cluster
- Create a new AKS cluster and attach the Grafana instance to it
az aks create \
  --name ${AKS_CLUSTER_NAME}  \
  --resource-group ${RG_NAME} \
  --node-count 1 \
  --enable-managed-identity  \
  --enable-azure-monitor-metrics \
  --enable-cost-analysis \
  --grafana-resource-id ${GRAFANA_RESOURCE_ID} \
  --azure-monitor-workspace-resource-id ${AZ_MONITOR_WORKSPACE_ID} \
  --tier Standard
- Get the credentials to access the cluster:
az aks get-credentials \
  --name ${AKS_CLUSTER_NAME} \
  --resource-group ${RG_NAME} \
  --file aks-labs.config
- Use the retrieved aks-labs.config file as your KUBECONFIG and add it to your environment
echo export KUBECONFIG=$PWD/aks-labs.config >> .envrc
source .envrc
In this example, the source command in bash opens the .envrc file and adds the environment variables from that file to your current terminal, so you can use them right away.
- Check that the credentials are working:
kubectl cluster-info
kubectl get nodes
Working on Grafana
With Azure Managed Grafana integrated with Azure Managed Prometheus, you can import kube-apiserver and etcd metrics dashboards.
Out of the box, only the etcd and kube-apiserver metrics data is being collected as part of the minimal ingestion profile for control plane metrics. This profile is designed to provide a balance between the cost of monitoring and the value of the data collected.
More on the minimal ingestion profile can be found here.
- Create a folder in Grafana to host our new dashboards:
az grafana folder create \
  --name ${GRAFANA_NAME} \
  --title AKS-Labs \
  --resource-group ${RG_NAME}
- Import the
kube-apiserverandetcddashboards into the new Grafana folder:
# import kube-apiserver dashboard
az grafana dashboard import \
  --name ${GRAFANA_NAME} \
  --resource-group ${RG_NAME} \
  --folder 'AKS-Labs' \
  --definition 20331

# import etcd dashboard
az grafana dashboard import \
  --name ${GRAFANA_NAME} \
  --resource-group ${RG_NAME} \
  --folder 'AKS-Labs' \
  --definition 20330
- To access the Grafana Dashboard
GRAFANA_UI=$(az grafana show \
  --name ${GRAFANA_NAME} \
  --resource-group ${RG_NAME} \
  --query "properties.endpoint" -o tsv)

echo "Your Azure Managed Grafana is accessible at: $GRAFANA_UI"
Expected output:
$ az grafana show \
  --name ${GRAFANA_NAME} \
  --resource-group ${RG_NAME} \
  --query "properties.endpoint" -o tsv
https://aks-labs-test-ase8bmffcgbqhjej.wus3.grafana.azure.com
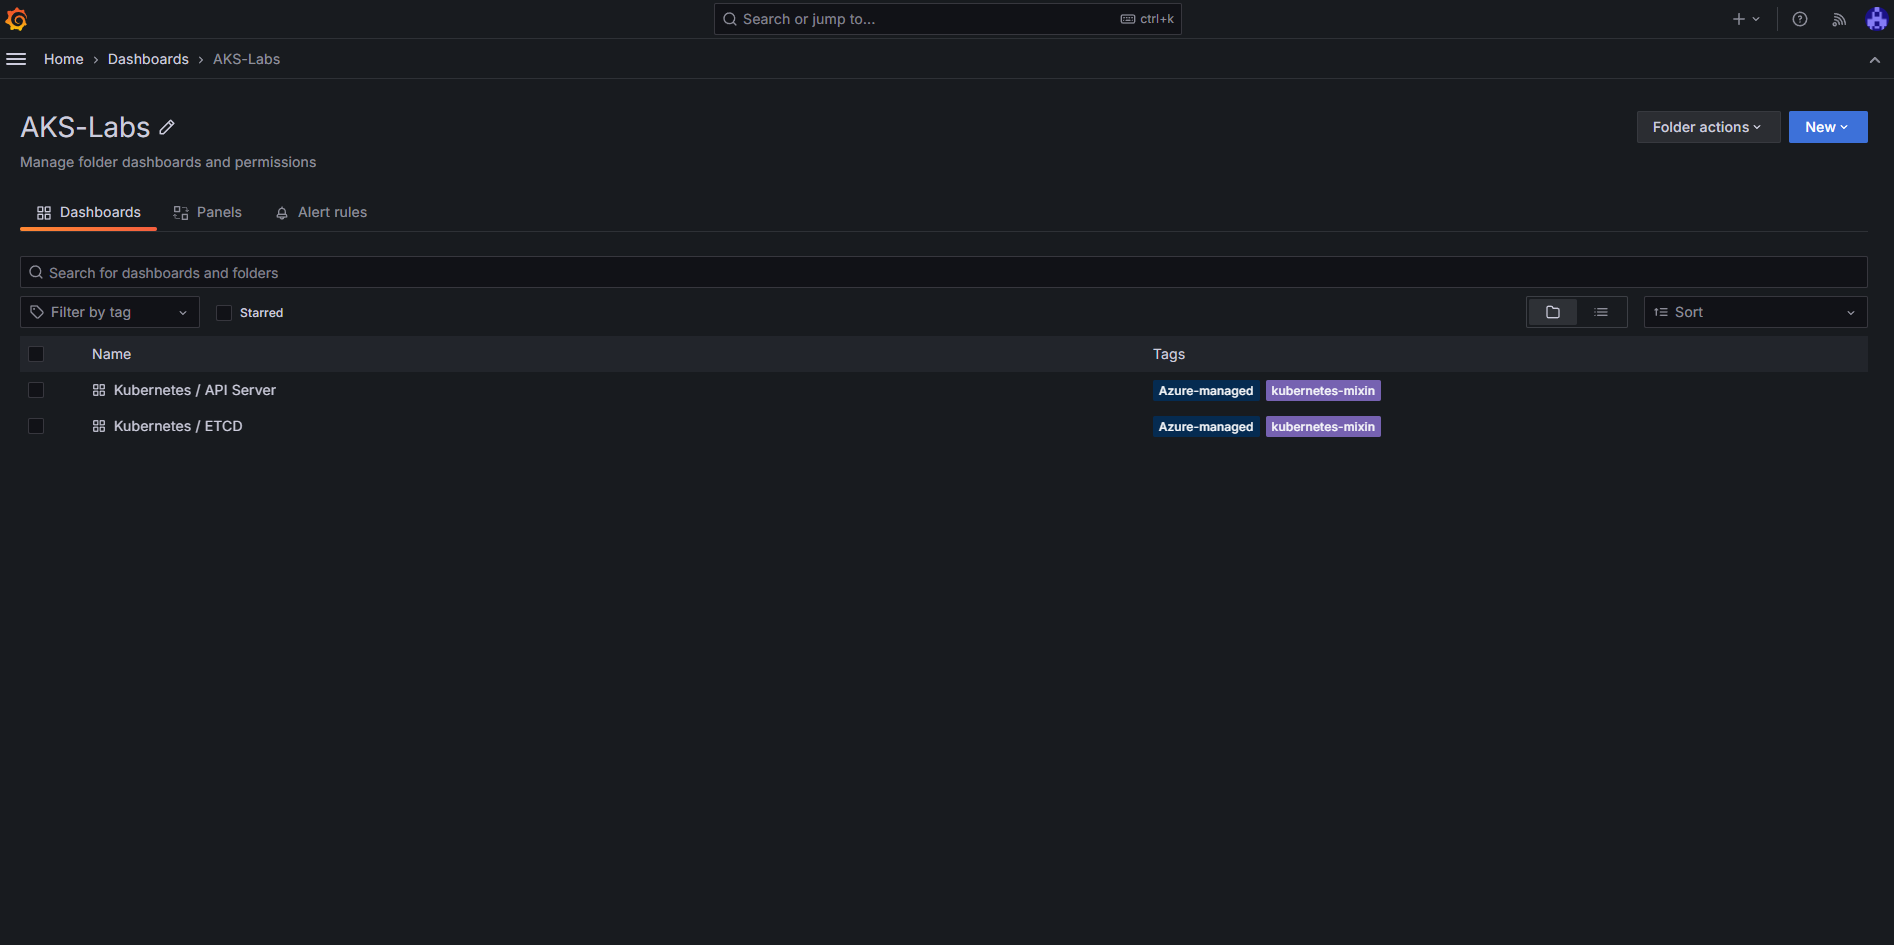 Now you, should be able to browse to your Azure Managed Grafana instance and see the
 kube-apiserver and etcd metrics dashboards in the AKS-Labs folder.
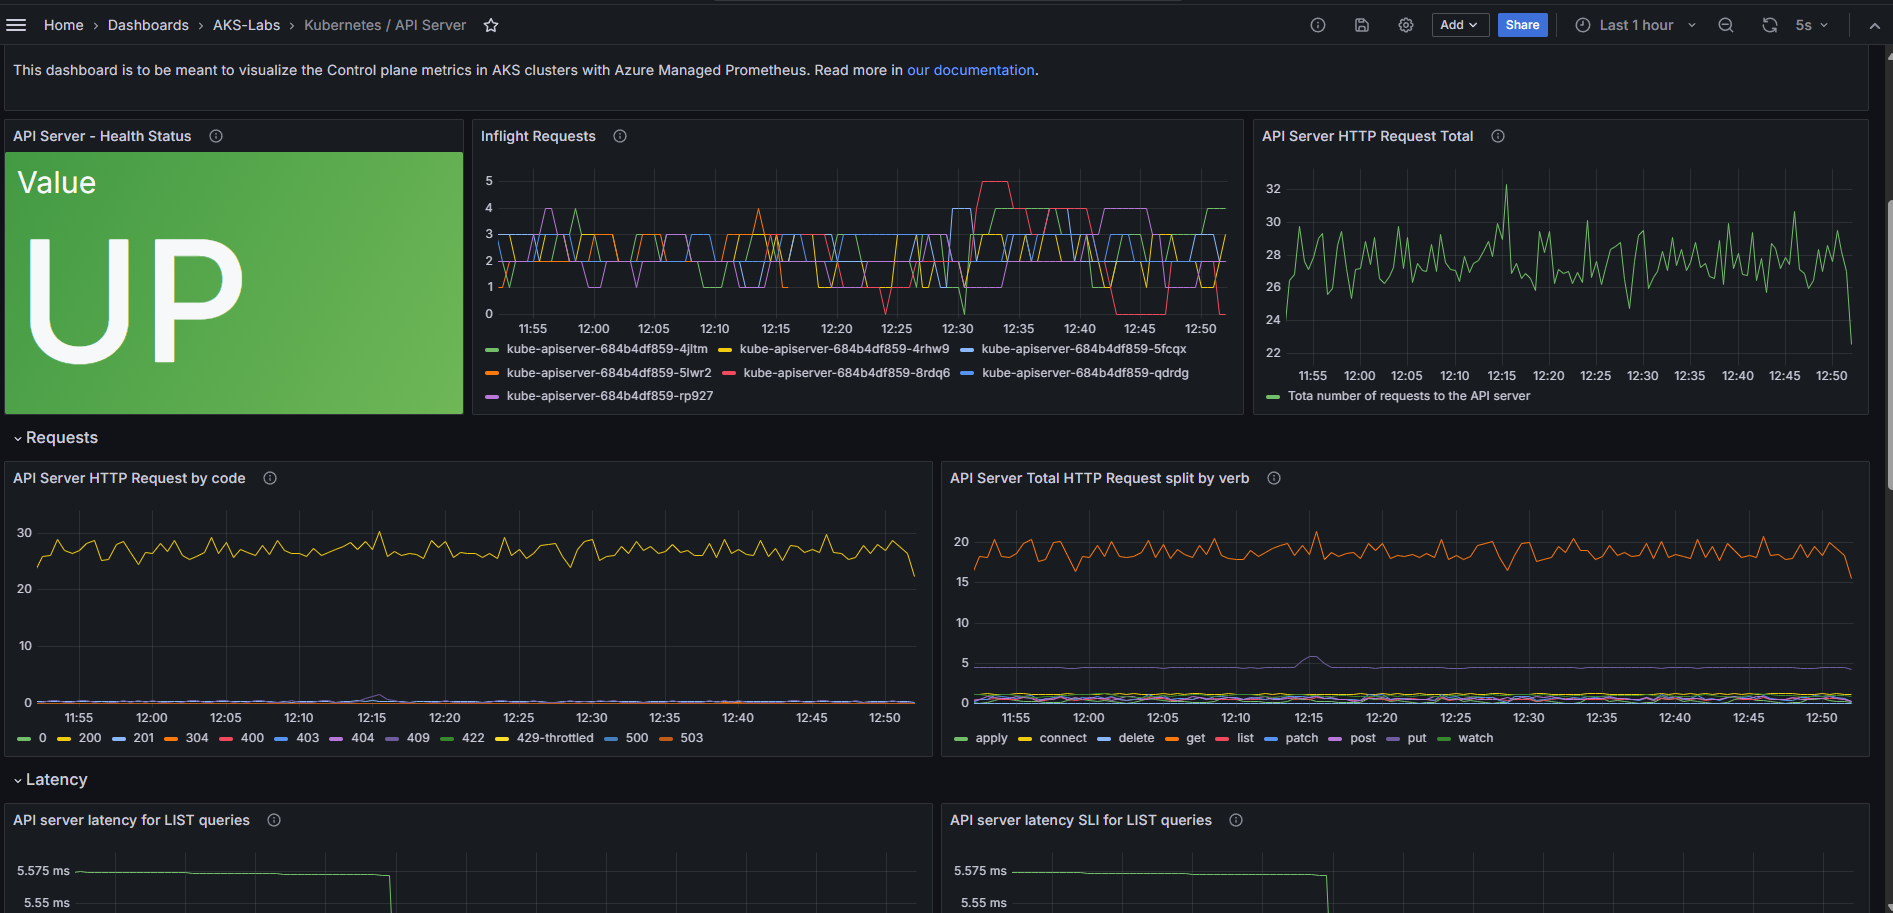 The new
 kube-apiserver metrics dashboard in Grafana.
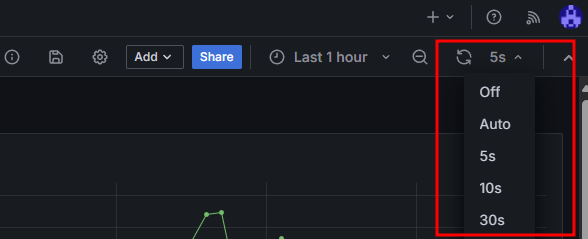
It might take up to 5 minutes for data to start showing up in your Grafana dashboard. You can refresh this page or set it to auto-refresh every few seconds
Example: Customizing the collection of metrics
At this point we already have the kube-apiserver and the etcd metrics being collected by Prometheus and displayed on Grafana. If you want to collect a different set of metrics, you can do so by manually enabling them and this can be done by deploying a ConfigMap named ama-metrics-settings-configmap in the kube-system namespace.
Here are some options:
-
Ingest only specific metrics from some targets - we are covering this example in the next section
Ingesting a new metric: apiserver_longrunning_requests
To illustrate the ingestion of a specific metric from some targets, lets edit the ama-metrics-settings-configmap to include a metric that is not a part of the minimal ingestion profile: apiserver_longrunning_requests. This metric will be collected from the controlplane-apiserver target.
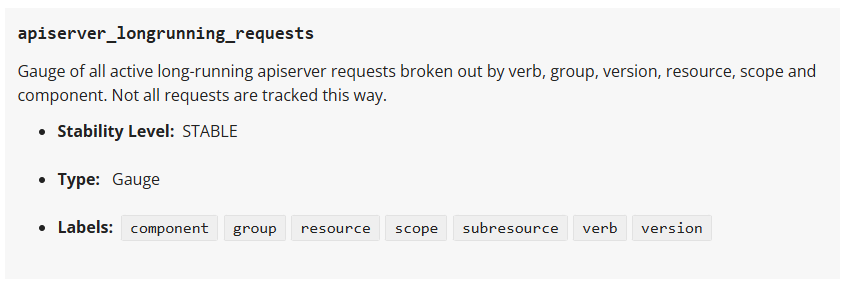 A description of the
 apiserver_longrunning_requests from the Kubernetes Metrics Reference
A full list of the available metrics is available at the Kubernetes Metrics Reference.
Steps to customize the collection of a new metric:
- Run the following command to deploy the ama-metrics-settings-configmap in the kube-system namespace.
kubectl apply -f https://raw.githubusercontent.com/Azure/prometheus-collector/refs/heads/main/otelcollector/configmaps/ama-metrics-settings-configmap.yaml
- Edit the ama-metrics-settings-configmap to enable the metrics you want to collect. Run the following command to edit the ama-metrics-settings-configmap.
kubectl edit cm ama-metrics-settings-configmap -n kube-system
- Under the
default-targets-metrics-keep-list, addapiserver_longrunning_requestsand then save theConfigMap.
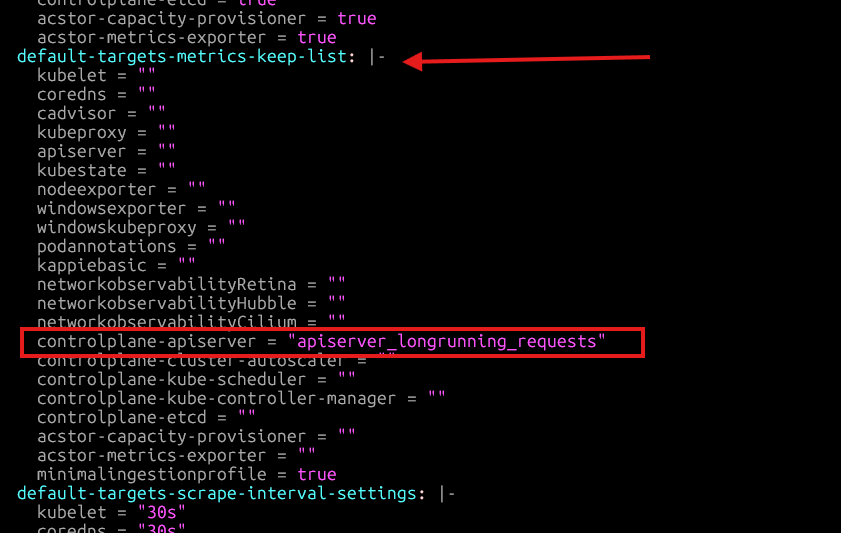
It might take 1 minute for the new metric to start showing up. We can check it in the Azure Monitor Workspace and then on Grafana.
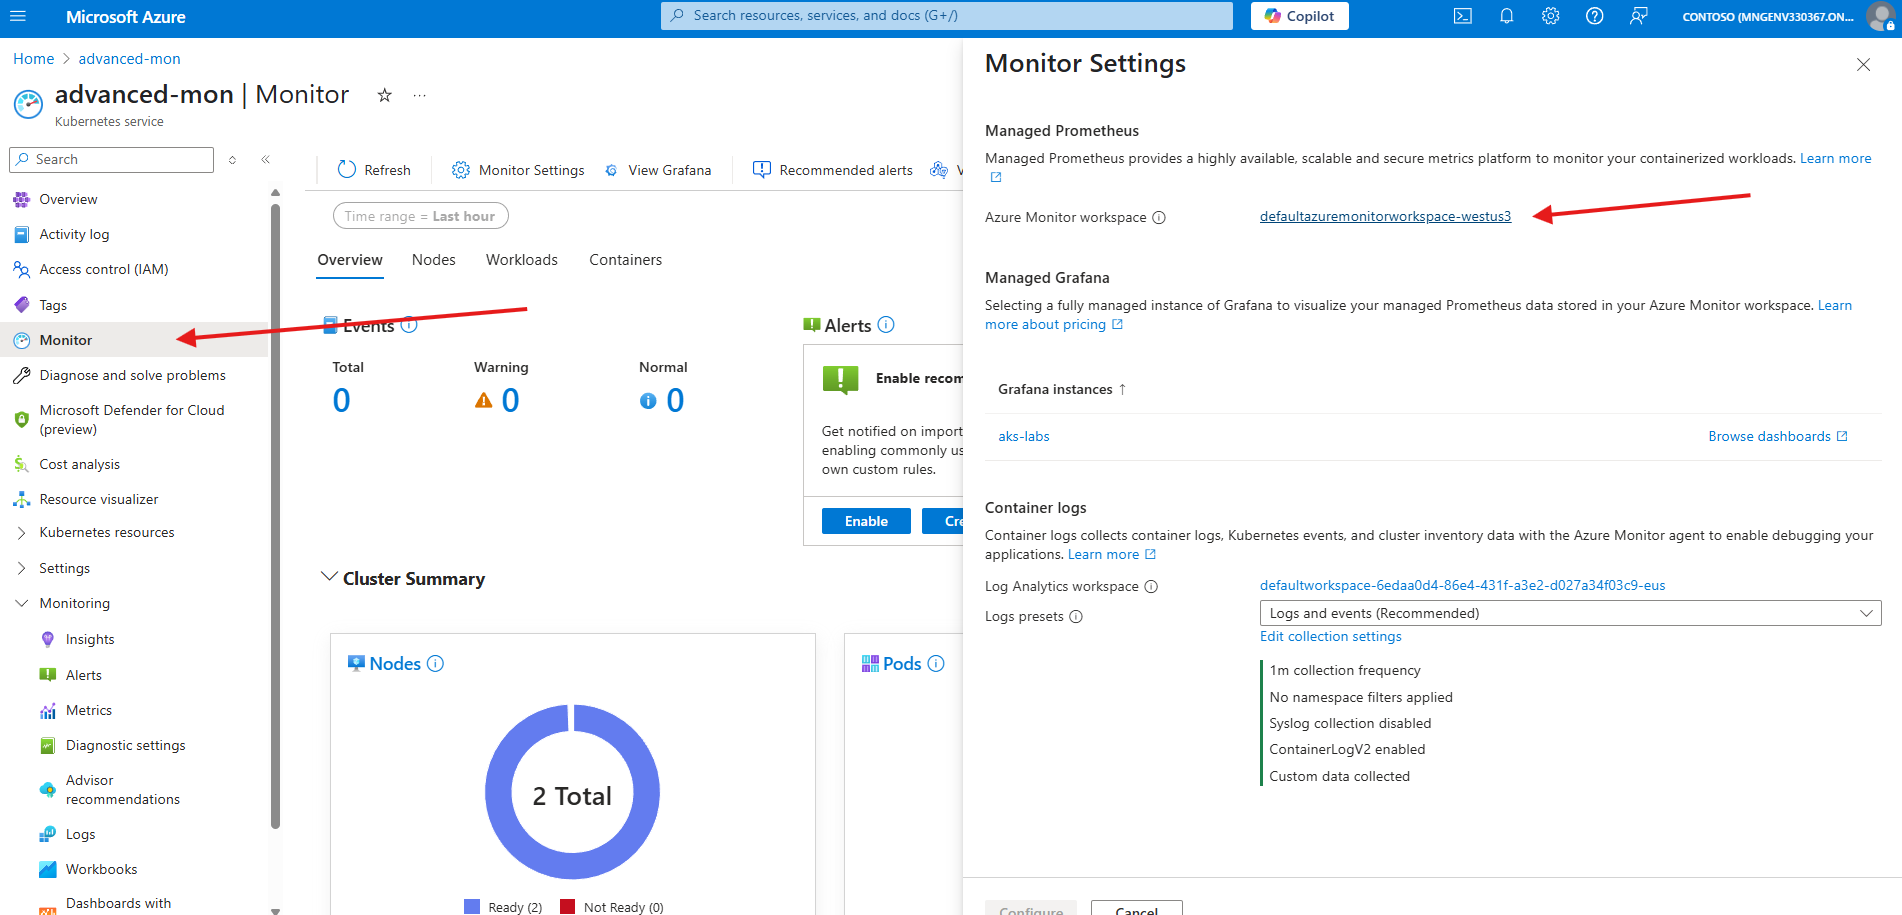
- Navigate to the Azure Monitor Workspace attached to the AKS cluster. You can find that information in the Azure Portal by navigating to the AKS Cluster created for this lab, then to Monitor, Monitor Settings. The information for the
Azure Monitor workspacewill be showed on this page.
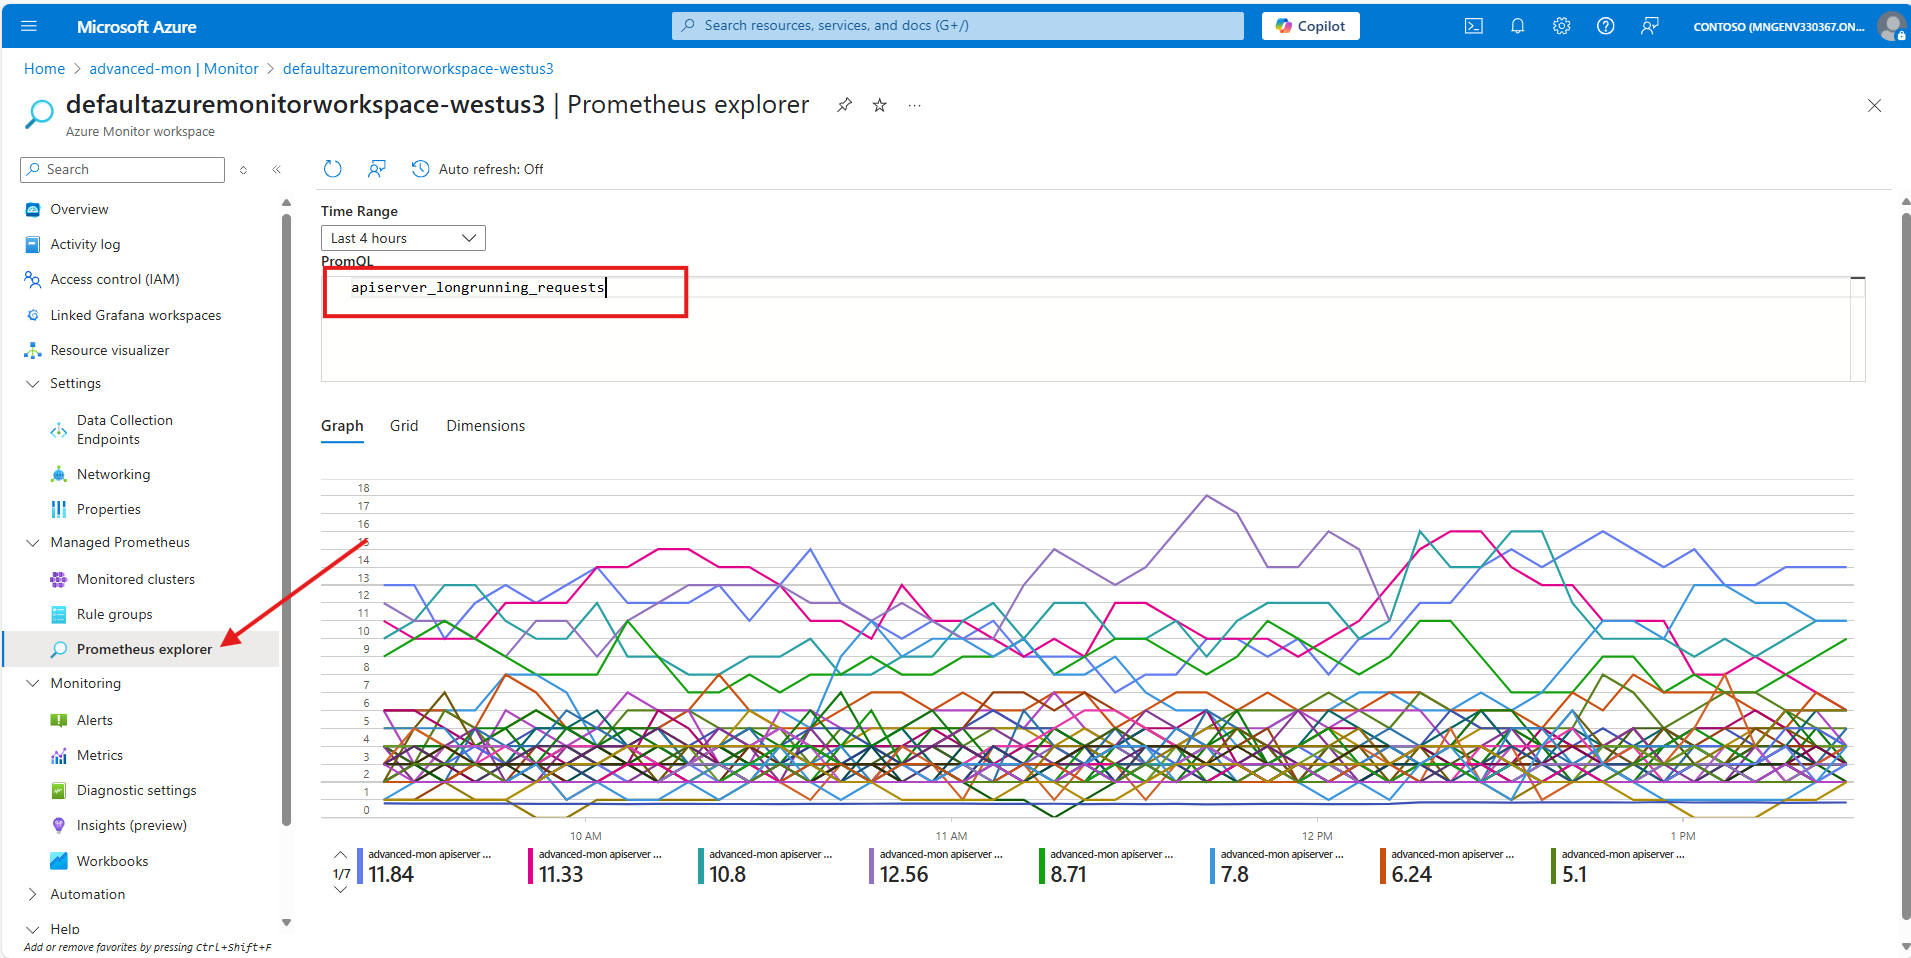
Once in the Azure Monitor workspace, navigate to the Prometheus Explorer and enter the apiserver_longrunning_requests in the PromQL searching box:
Create a dashboard in Grafana to visualize the new metric
Navigate to your Manage Grafana Instance, click on Dashboards->AKS-Labs->API Server
Click on Add and then Visualization
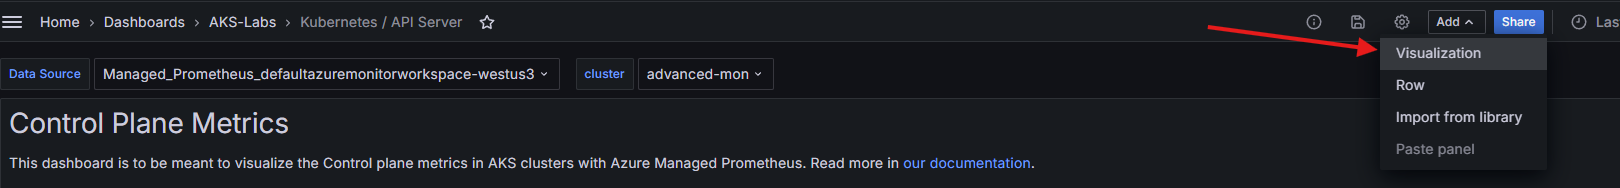
Verify that your selected Data Source is ${prom_ds}
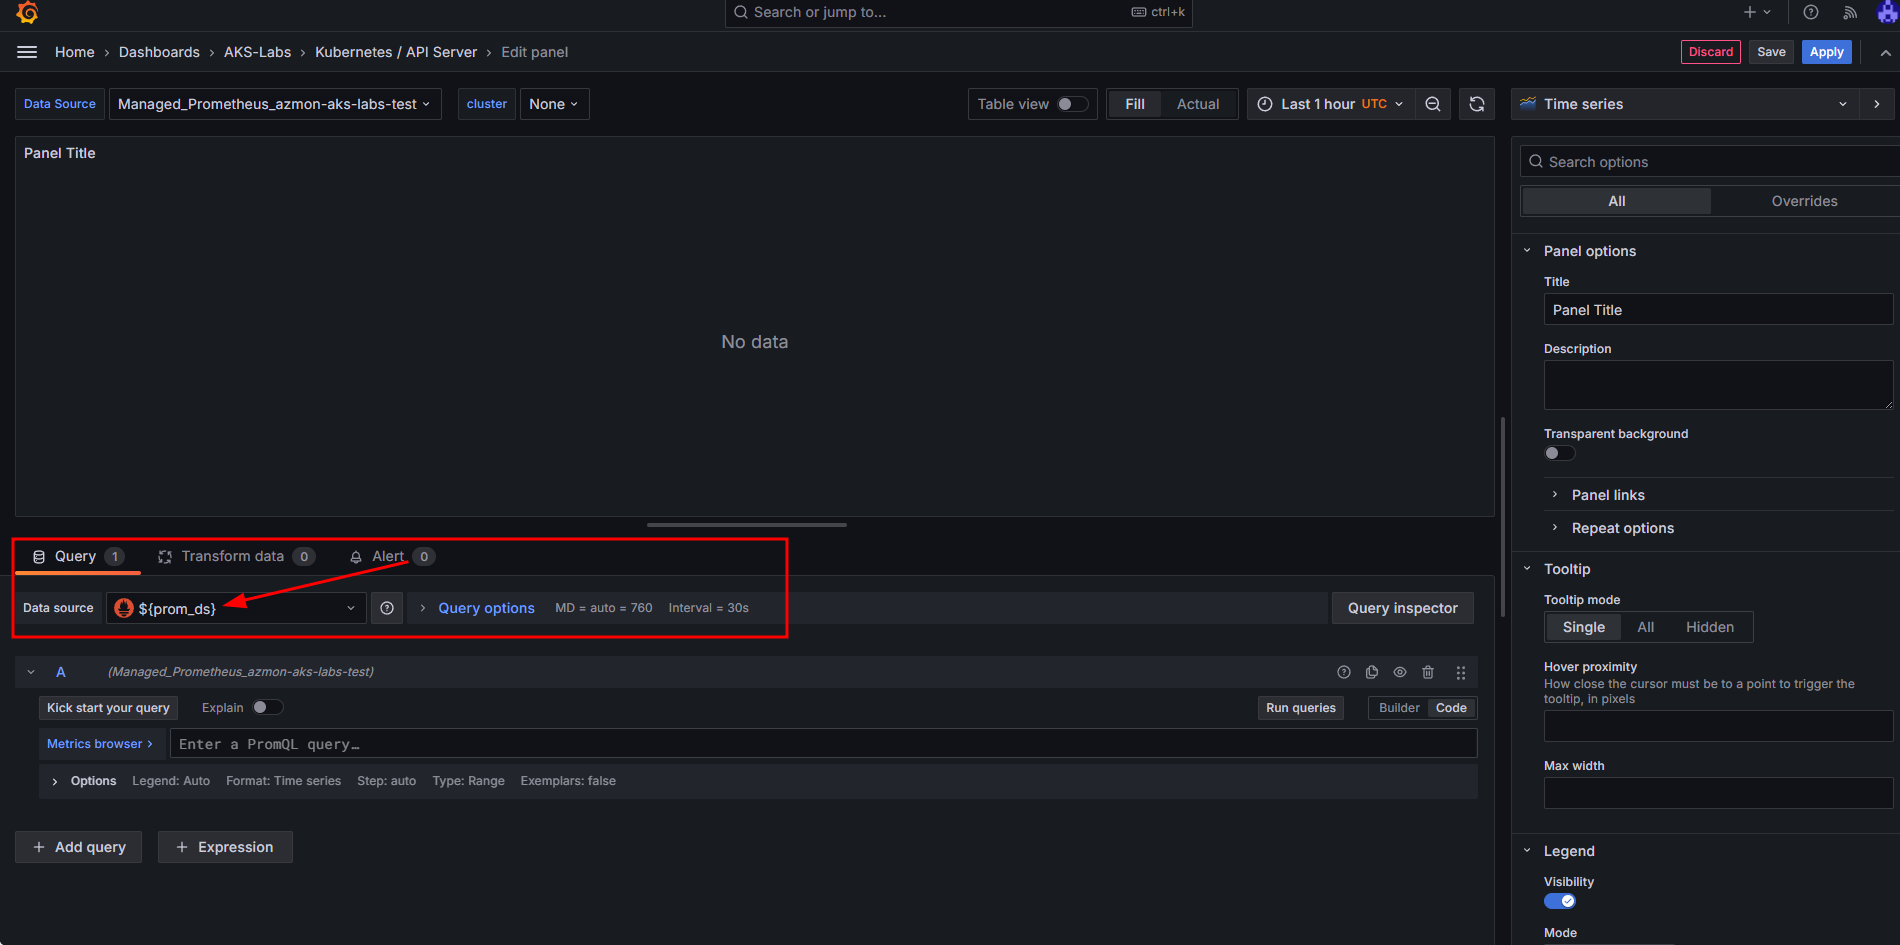
To customize the visualization, we need to first toggle the Code button in the Query part of the panel:
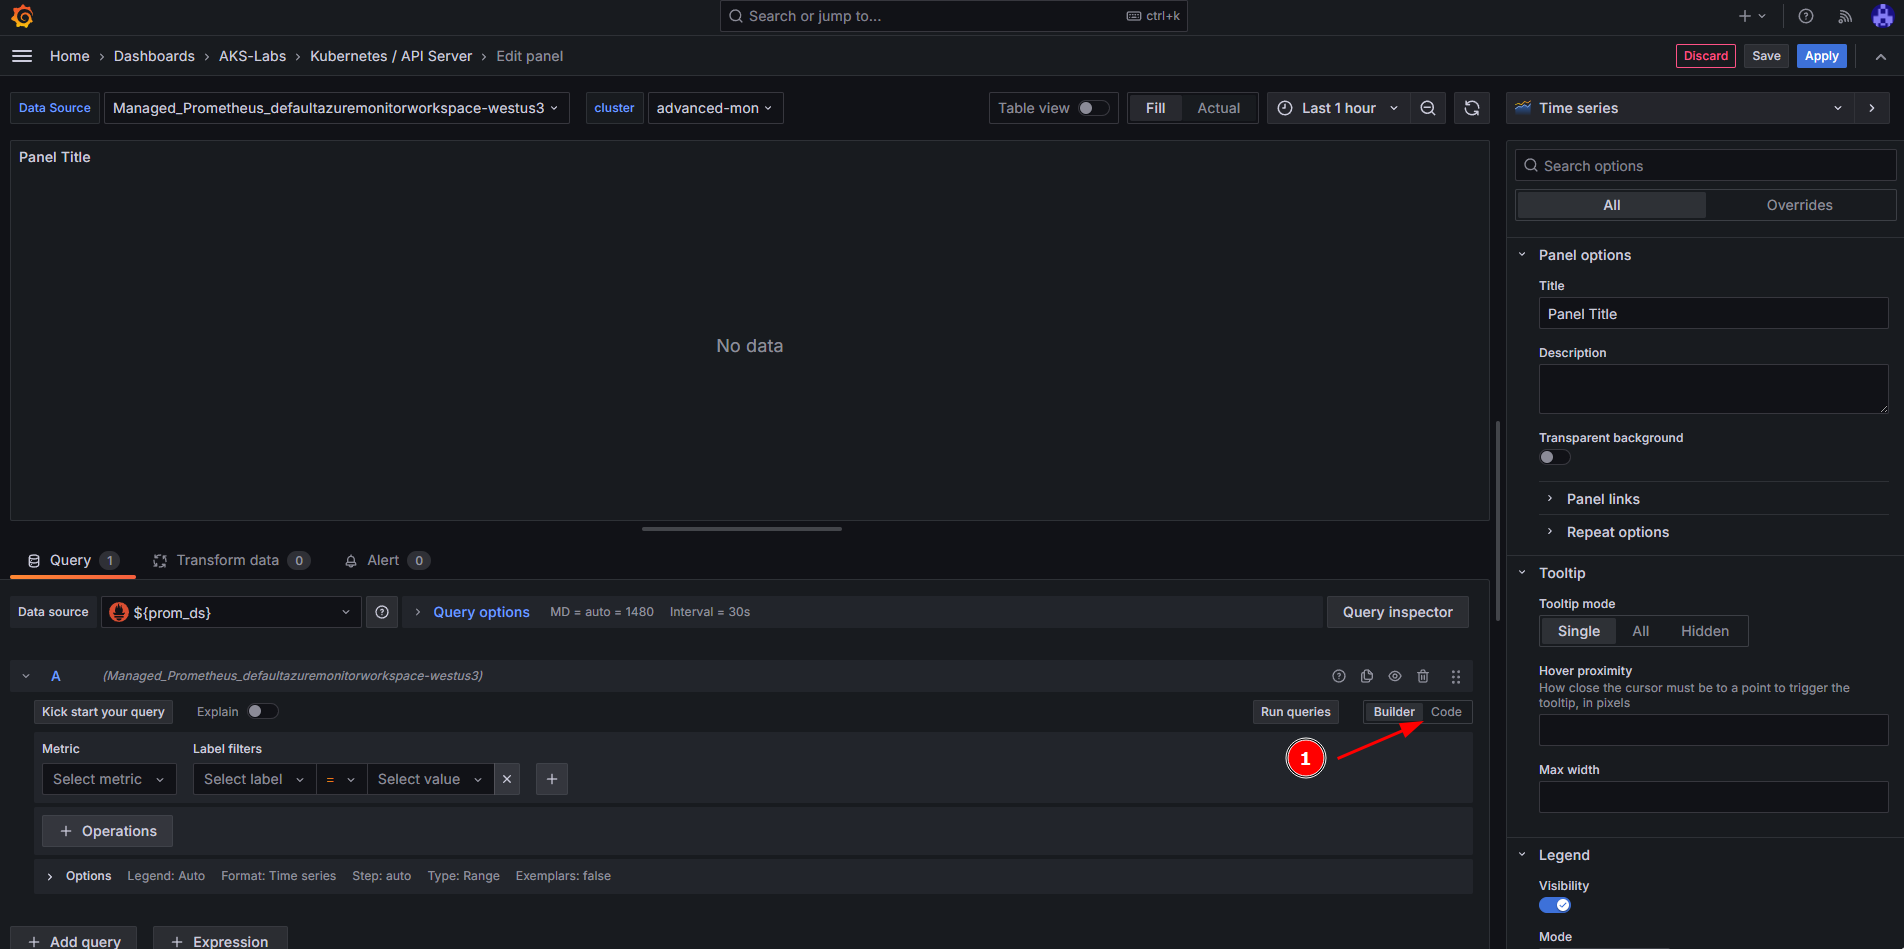
Next, we will do the following steps on this panel:
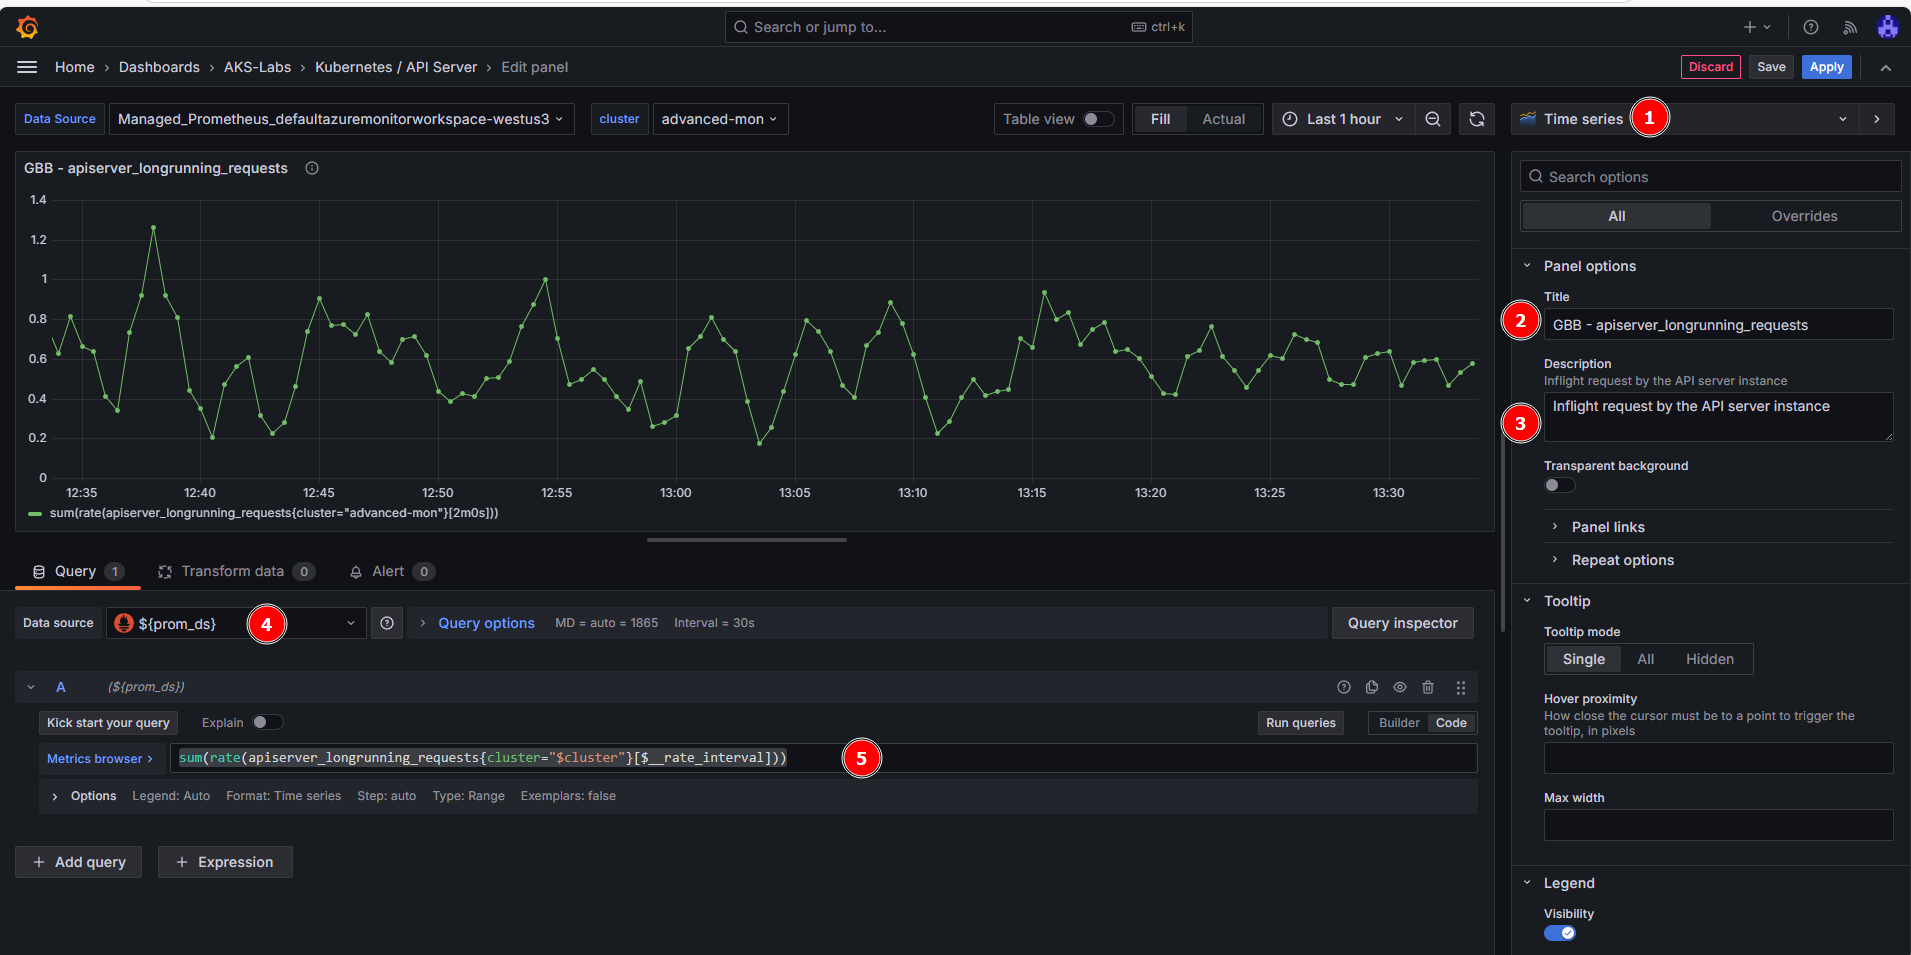
- Create a new
Time seriesdashboard (should be the default visualization). - Add a
Title(e.g.: apiserver_longrunning_requests) - Add a
Description(e.g.: Gauge of all active long-running apiserver requests broken out by verb, group, version, resource, scope and component.). - Make sure the Managed Prometheus (
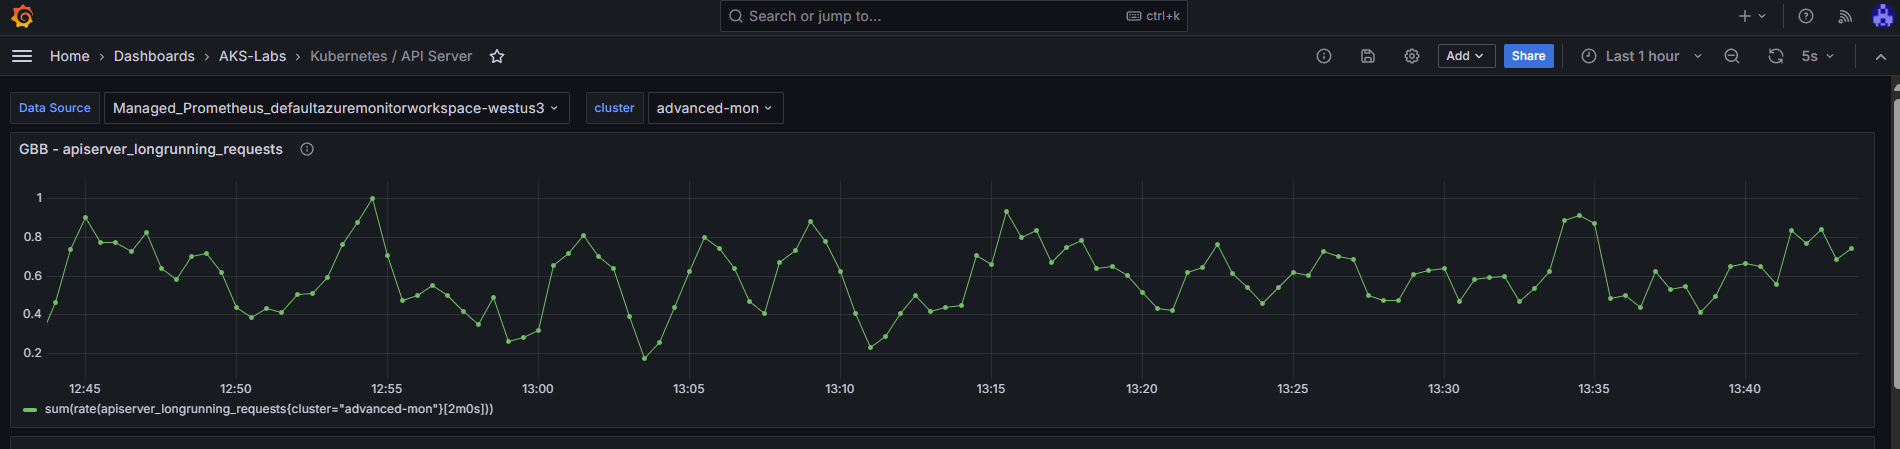
${prom_ds}) is selected in the Data source. - In the metrics browser, add this query:
sum(rate(apiserver_longrunning_requests{cluster="$cluster"}[$__rate_interval]))
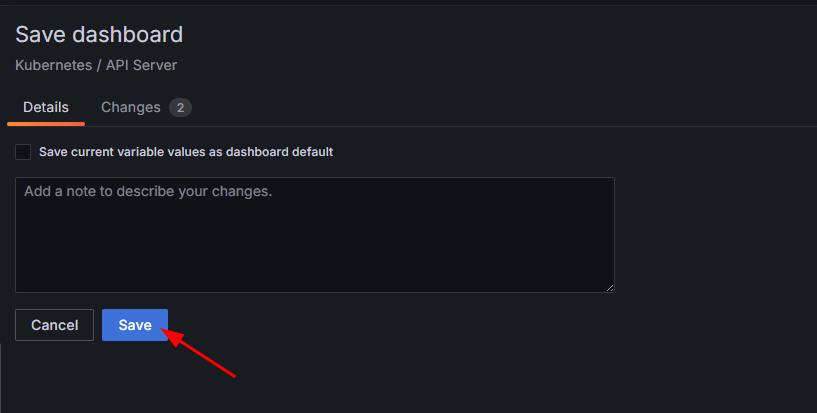
- Click on Save
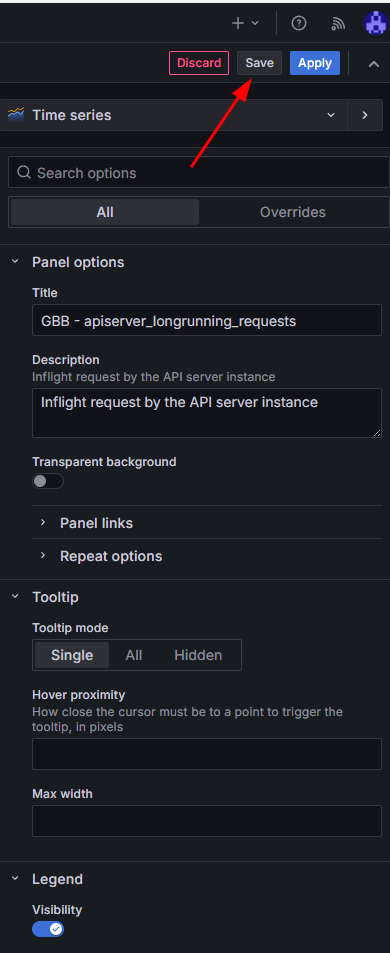
- Finally, click on Save Dashboard
After close to 5 minutes, you should start seeing the apiserver_longrunning_requests metrics showing up in your new dashboard
Congratulations, you have managed to add a specific metric from the controlplane-apiserver!
The Azure team does not offer a pre-built dashboard for some of these metrics, but you can reference the doc on supported metrics for Azure Managed Prometheus and create your own dashboards in Azure Managed Grafana or search for community dashboards on Grafana.com and import them into Azure Managed Grafana. Just be sure to use the Azure Managed Prometheus data source.
Custom scrape jobs for Azure Managed Prometheus
Typically, when you want to scrape metrics from a target, you would create a scrape job in Prometheus. With Azure Managed Prometheus, you can define custom scrape jobs for your AKS cluster using the PodMonitor and ServiceMonitor Custom Resource Definitions (CRDs), which are automatically created when you enable Azure Managed Prometheus.
These CRDs are nearly identical to their open-source Prometheus counterparts, with the main difference being the apiVersion.
When using Azure Managed Prometheus, specify the apiVersion as:
azmonitoring.coreos.com/v1 instead of the OSS version: monitoring.coreos.com/v1
What are PodMonitor and ServiceMonitor?
| CRD Type | Targets | Use Case | Requires Service? |
|---|---|---|---|
PodMonitor | Pods (via labels) | Scrape metrics directly from pods (e.g., sidecar exporters) | no |
ServiceMonitor | Services (via labels) | Scrape metrics through stable service endpoints (e.g., API svc) | yes |
This separation allows you to control how Prometheus discovers and scrapes metrics based on how your application is exposed in the cluster.
Deploying a PodMonitor and a Sample Application
Let’s walk through deploying a reference app and a PodMonitor to collect metrics.
1. Deploy a reference app
kubectl apply -f https://raw.githubusercontent.com/Azure/prometheus-collector/refs/heads/main/internal/referenceapp/prometheus-reference-app.yaml
Verify it's running:
kubectl get pods,svc -l app=prometheus-reference-app
Expected output:
NAME                                            READY   STATUS    RESTARTS   AGE
pod/prometheus-reference-app-xxxxxxxxxx-xxxxx   2/2     Running   0          77s

NAME                                   TYPE        CLUSTER-IP    EXTERNAL-IP   PORT(S)                      AGE
service/prometheus-reference-service   ClusterIP   10.0.69.176   <none>        2112/TCP,2113/TCP,2114/TCP   77s
2. Deploy a PodMonitor
kubectl apply -f https://raw.githubusercontent.com/Azure/prometheus-collector/refs/heads/main/otelcollector/deploy/example-custom-resources/pod-monitor/pod-monitor-reference-app.yaml
Custom metrics targets are scraped by pods with names like ama-metrics-*. The Prometheus Agent UI is exposed on port 9090, allowing inspection of scrape jobs.
3. Get the AMA Prometheus pod name
AMA_METRICS_POD_NAME="$(kubectl get po -n kube-system -lrsName=ama-metrics -o jsonpath='{.items[0].metadata.name}')"
4. Port-forward Prometheus locally
kubectl port-forward ${AMA_METRICS_POD_NAME} -n kube-system 9090
Open your browser at: http://localhost:9090
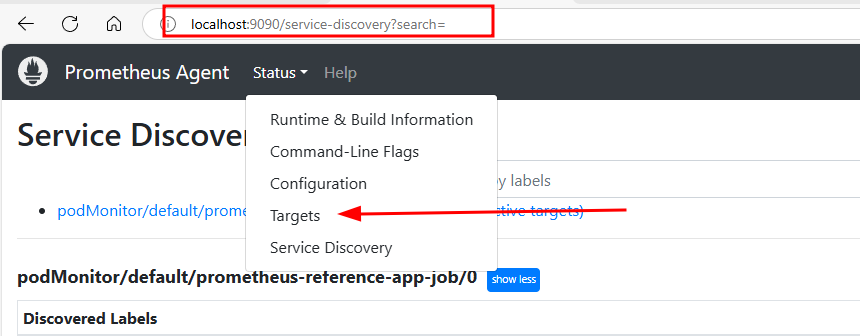
-
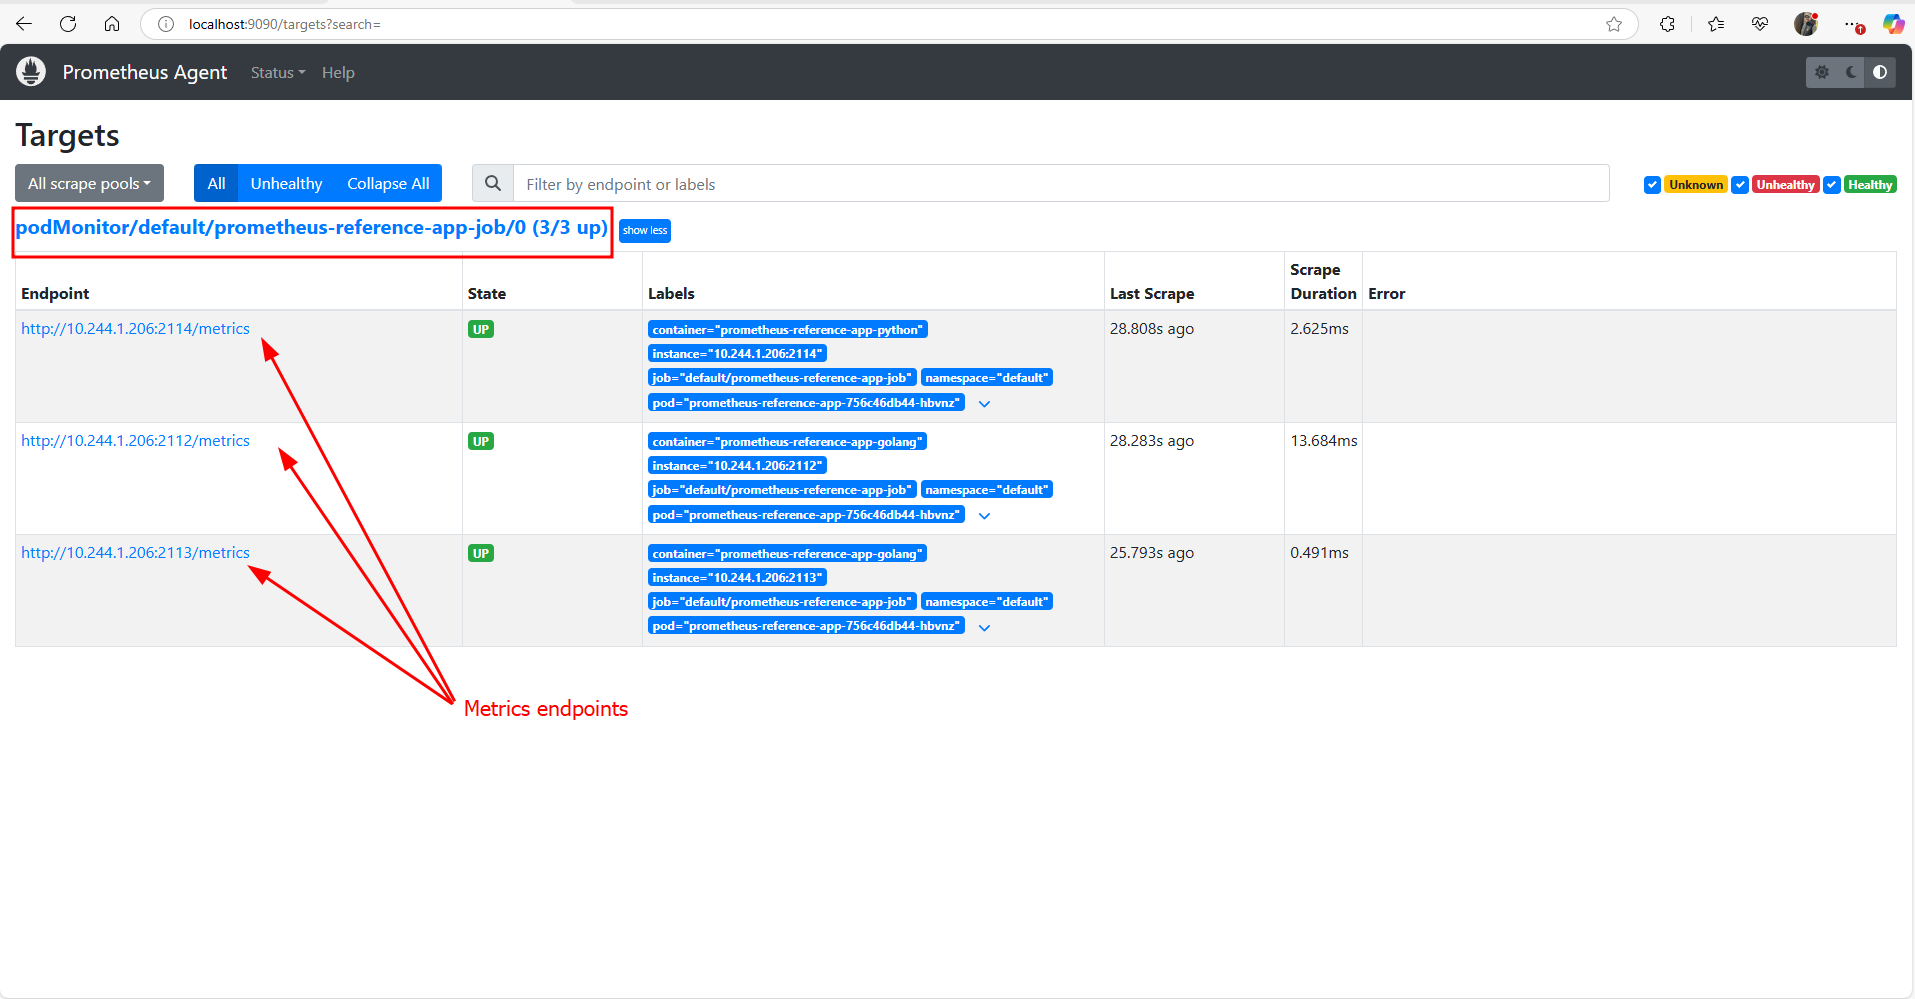
Under Status > Targets, you'll find the target:
podMonitor/default/prometheus-reference-app-job/0 -
Under Status > Service Discovery, you'll see label-discovered targets for the same.
When you're done, stop port-forwarding by pressing Ctrl+C.
Inspecting the Raw Metrics from the Reference Application
In addition to viewing metrics in Prometheus or Grafana, you can directly access the raw metrics exposed by the reference app on port 2112 using a simple port-forward.
1. Port-forward to the reference app pod
kubectl port-forward svc/prometheus-reference-service 2112:2112
2. Open your browser or use curl
Now you can navigate to http://localhost:2112/metrics in your browser, or run:
curl http://localhost:2112/metrics
Example output:
max_dimension_rainfall{city="chennai",location="midwest"} 0.24
max_dimension_rainfall{city="chicago",location="midwest"} 0.07
max_dimension_rainfall{city="dc",location="east"} 0.137
max_dimension_rainfall{city="dc",location="midwest"} 0.18700000000000003
max_dimension_rainfall{city="delhi",location="midwest"} 0.05
max_dimension_rainfall{city="hyderabad",location="midwest"} 0.09300000000000001
max_dimension_rainfall{city="indianapolis",location="midwest"} 0.10300000000000001
max_dimension_rainfall{city="indore",location="midwest"} 0.10700000000000001
max_dimension_rainfall{city="jaipur",location="midwest"} 0.11
max_dimension_rainfall{city="kanpur",location="midwest"} 0.19
max_dimension_rainfall{city="kolkata",location="midwest"} 0.23
max_dimension_rainfall{city="lucknow",location="midwest"} 0.147
max_dimension_rainfall{city="milwaukee",location="midwest"} 0.1
max_dimension_rainfall{city="minneapolis",location="midwest"} 0.11
max_dimension_rainfall{city="mumbai",location="midwest"} 0.14
max_dimension_rainfall{city="nagpur",location="midwest"} 0.183
max_dimension_rainfall{city="new york",location="east"} 0.18
max_dimension_rainfall{city="new york",location="midwest"} 0.11
max_dimension_rainfall{city="orlando",location="midwest"} 0.14
max_dimension_rainfall{city="orlando",location="south"} 0.16
max_dimension_rainfall{city="portland",location="midwest"} 0.21
These are standard Prometheus metrics types (counter, gauge, histogram, summary) designed for testing.
This is helpful for verifying what metrics are exposed by your application before defining scrape jobs or visualizations.
Once finished, press Ctrl+C to stop the port-forward session.
Explore the Metrics in Grafana
Once metrics have been scraped for a few moments we can now use the Explore capability in Grafana to visualize the new metrics.
-
Open Azure Managed Grafana, go to the Explore tab
-
Change the Data Source from
Azure MonitortoManaged_Prometheus_azmon-adk-labs.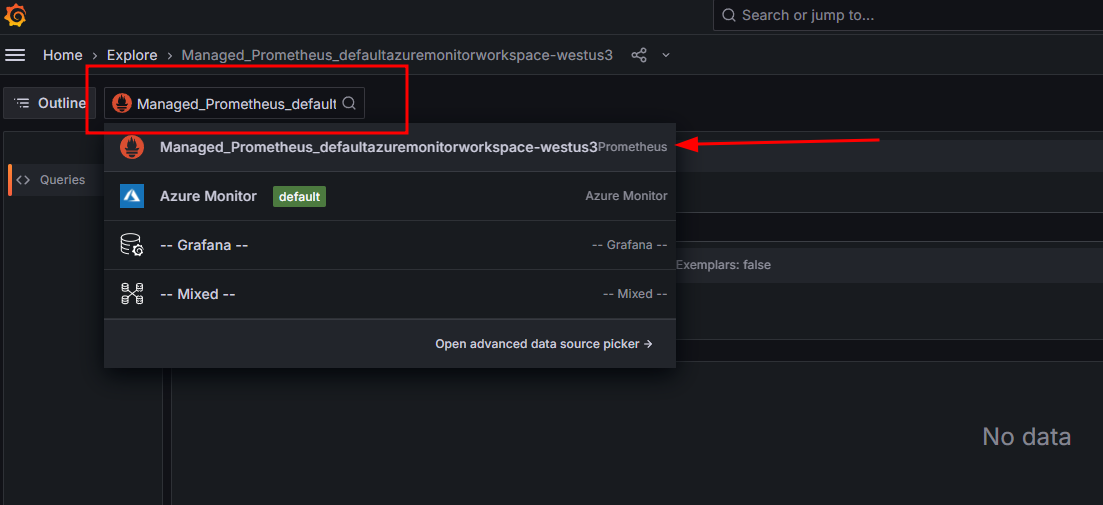
-
For example, we can try to query for the
max_dimension_rainfall_histogram_bucketmetric
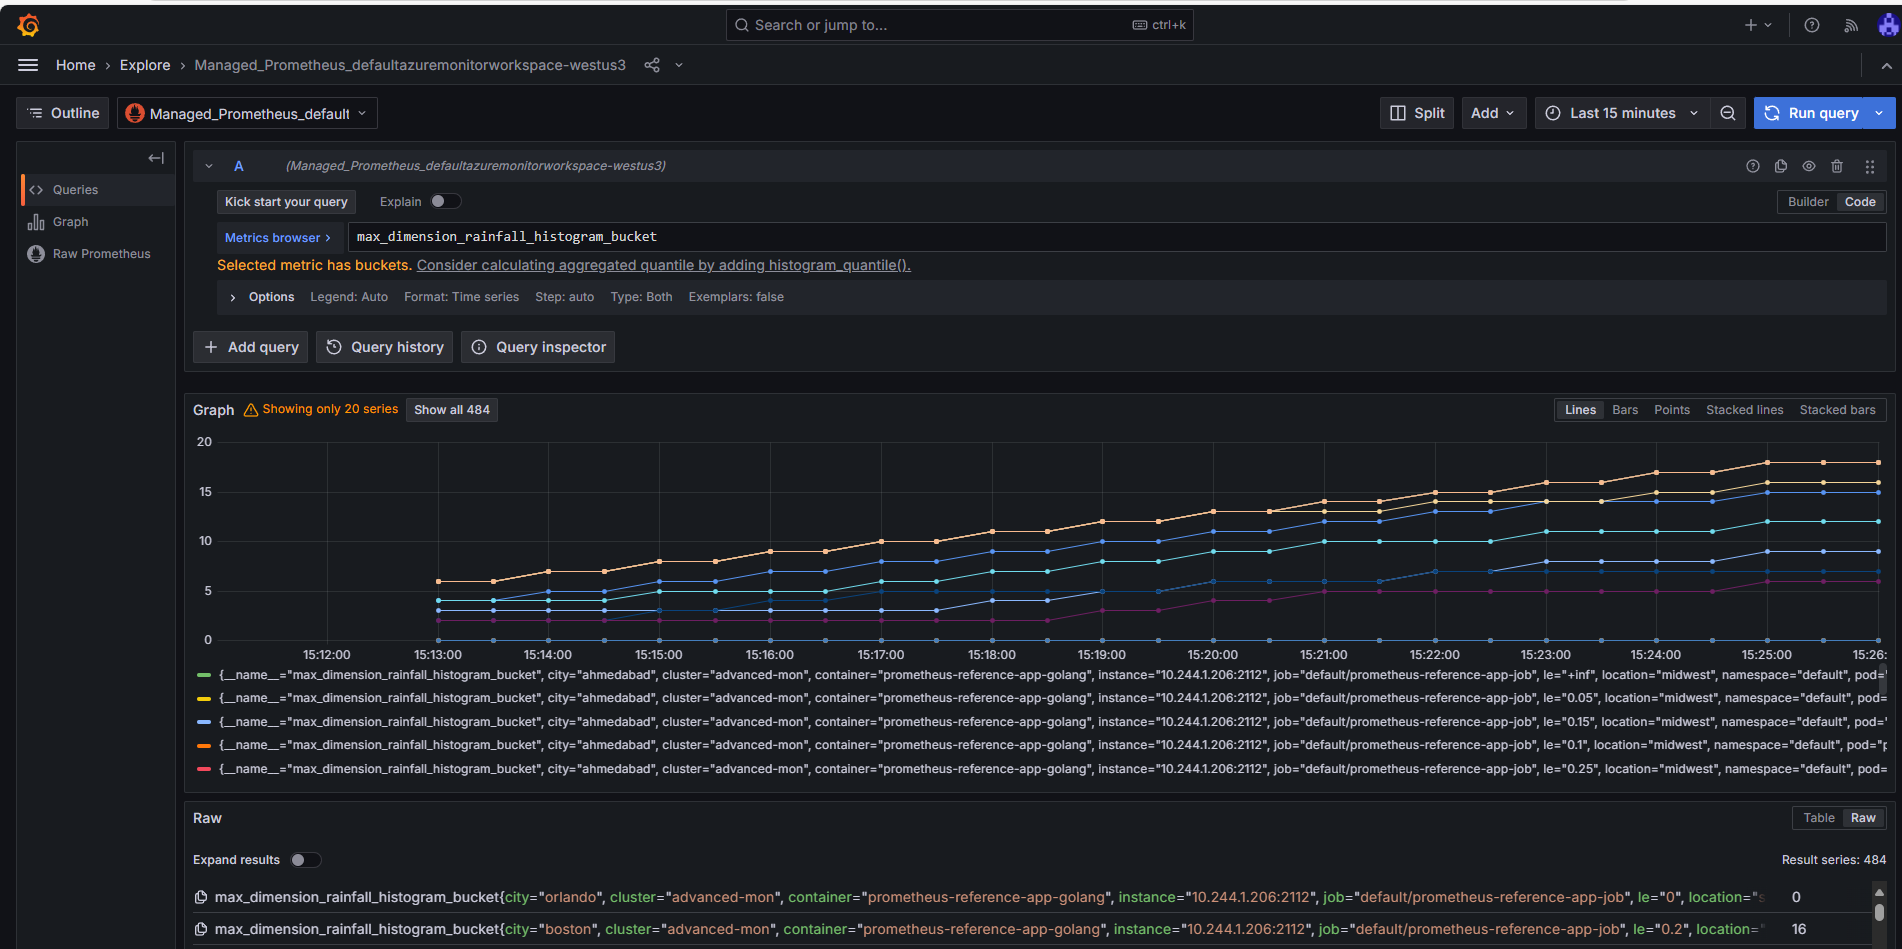
We can now see the new PodMonmitor metrics showing up in Grafana ! From there, you can create your own dashboard using the same principles we saw earlier when we created a dashboard in Grafana to visualize a new metric
Summary
In this lab, we accomplished the following:
-
Enabled the preview feature for AKS control plane metrics using Azure CLI.
-
Deployed a new AKS cluster integrated with Azure Managed Prometheus and Azure Managed Grafana.
-
Imported pre-built dashboards to visualize control plane metrics (
kube-apiserverandetcd) in Grafana. -
Customized metric ingestion by editing the
ama-metrics-settings-configmapto include specific metrics likeapiserver_longrunning_requests. -
Deployed a reference application and configured a custom PodMonitor to scrape application metrics using Azure Managed Prometheus.
-
Verified custom metrics collection using both the Prometheus UI and Azure Managed Grafana.