Advanced Container Networking Services
Advanced Container Networking Services (ACNS) enhances AKS operational capabilities through two key pillars:
- Security: Cilium Network policies with FQDN filtering and L7 policy support (for Azure CNI Powered by Cilium clusters)
- Observability: Hubble's control plane for networking visibility, performance insights, and cost-optimized metrics collection (supports both Cilium and non-Cilium Linux data planes)
ACNS delivers smart observability at low cost -- cut the noise and cut the cost by focusing on the metrics and logs that matter most.
- Container Network Metrics: Deep service-to-service insights (DNS, workload behavior) to spot latency, drops, and anomalous patterns earlier.
- Container Network Flow Logs: Rich flow metadata (source/destination, ports, protocols) to accelerate troubleshooting and security investigations.
Result: Faster root-cause isolation, clearer cost signals, actionable insights--reducing metrics volume and storage costs by up to 90%.
Objectives
In this lab, you will learn how to secure, observe, and troubleshoot network traffic in Azure Kubernetes Service using Advanced Container Networking Services (ACNS).
- Apply network policies (standard, FQDN-based, and Layer 7 HTTP) to control pod-to-pod and external traffic.
- Detect network anomalies using Azure Managed Grafana dashboards for real-time metrics monitoring.
- Enable Container Network Flow Logs and diagnose connectivity issues using KQL queries in Log Analytics.
- Visualize network flow logs using Azure Managed Grafana dashboards.
- Configure container network metrics filtering to reduce metrics volume, lower storage costs, and focus on the data that matters.
- Compare traditional troubleshooting approaches with ACNS-enabled workflows to reduce diagnosis time from hours to minutes.
- (Optional) Explore Hubble CLI and UI for real-time network flow observation.
Prerequisites
Before starting this lab, make sure your environment is set up correctly. Follow the guide here:
- Azure Subscription
- Azure CLI version 2.75.0 or later with the aks-preview Azure CLI extension installed
- kubectl version 1.33.0 or later
- A terminal with
bash(e.g.: Windows Terminal with WSL or Azure Cloud Shell)
The minimum version of the aks-preview Azure CLI extension to complete the steps in this article is 19.0.07.
Setup Azure CLI
Start by logging into Azure by run the following command and follow the prompts:
az login --use-device-code
You can log into a different tenant by passing in the --tenant flag to specify your tenant domain or tenant ID.
Run the following command to register preview features.
az extension add --name aks-preview
Register Preview Features
This workshop will need some Azure preview features enabled and resources to be pre-provisioned. You can use the Azure CLI commands below to register the preview features.
az feature register --namespace "Microsoft.ContainerService" --name "AdvancedNetworkingFlowLogsPreview"
az feature register --namespace "Microsoft.ContainerService" --name "AdvancedNetworkingL7PolicyPreview"
az feature register --namespace "Microsoft.ContainerService" --name "AdvancedNetworkingDynamicMetricsPreview"
Setup Resource Group
In this workshop, we will set environment variables for the resource group name and location.
The following commands will set the environment variables for your current terminal session. If you close the current terminal session, you will need to set the environment variables again.
To keep the resource names unique, we will use a random number as a suffix for the resource names. This will also help you to avoid naming conflicts with other resources in your Azure subscription.
Run the following command to generate a random number.
RAND=$RANDOM
export RAND
echo "Random resource identifier will be: ${RAND}"
Set the location to a region of your choice. For example, eastus or westeurope but you should make sure this region supports availability zones.
export LOCATION=eastus
Create a resource group name using the random number.
export RG_NAME=myresourcegroup$RAND
You can list the regions that support availability zones with the following command:
az account list-locations \
--query "[?metadata.regionType=='Physical' && metadata.supportsAvailabilityZones==true].{Region:name}" \
--output table
Run the following command to create a resource group using the environment variables you just created.
az group create \
--name ${RG_NAME} \
--location ${LOCATION}
Setup Azure Monitor Workspace
Create an Azure Monitor workspace for Prometheus metrics before creating the cluster.
export AZURE_MONITOR_NAME=azuremonitor$RAND
Create the Azure Monitor workspace:
az monitor account create \
  --name ${AZURE_MONITOR_NAME} \
  --resource-group ${RG_NAME} \
  --location ${LOCATION}
Save the Azure Monitor workspace resource ID:
export AZURE_MONITOR_ID=$(az monitor account show \
  --name ${AZURE_MONITOR_NAME} \
  --resource-group ${RG_NAME} \
  --query id -o tsv)
Cost note: The Azure Monitor workspace is not deleted when you delete the AKS cluster with
az aks delete. In the cleanup section, delete the${RG_NAME}resource group to remove this workspace as well. If you want to keep the resource group, delete just the workspace instead:
Setup AKS Cluster
Set the AKS cluster name.
export AKS_NAME=myakscluster$RAND
Run the following command to create an AKS cluster with ACNS enabled.
az aks create \
  --name ${AKS_NAME} \
  --resource-group ${RG_NAME} \
  --location ${LOCATION} \
  --pod-cidr 192.168.0.0/16 \
  --tier standard \
  --max-pods 250 \
  --vm-size Standard_D4_v3 \
  --network-plugin azure \
  --network-plugin-mode overlay \
  --network-dataplane cilium \
  --generate-ssh-keys \
  --kubernetes-version 1.33 \
  --enable-acns \
  --enable-container-network-logs \
  --acns-advanced-networkpolicies L7 \
  --enable-addons monitoring \
  --enable-azure-monitor-metrics \
  --azure-monitor-workspace-resource-id ${AZURE_MONITOR_ID}
When you enable monitoring add-ons, Azure will automatically create:
- A Log Analytics workspace for container insights and flow logs
- An Azure Managed Grafana instance for visualization
The Azure Monitor workspace for Prometheus metrics is explicitly created above and linked to the cluster.
Connect to the AKS Cluster
Run the following command to get the AKS cluster credentials and configure kubectl.
az aks get-credentials --resource-group "${RG_NAME}" --name "${AKS_NAME}"
Deploy a Sample Application
We'll deploy the AKS Store Demo application. The store also includes an 'All-in-One' deployment option, which makes installation simple.
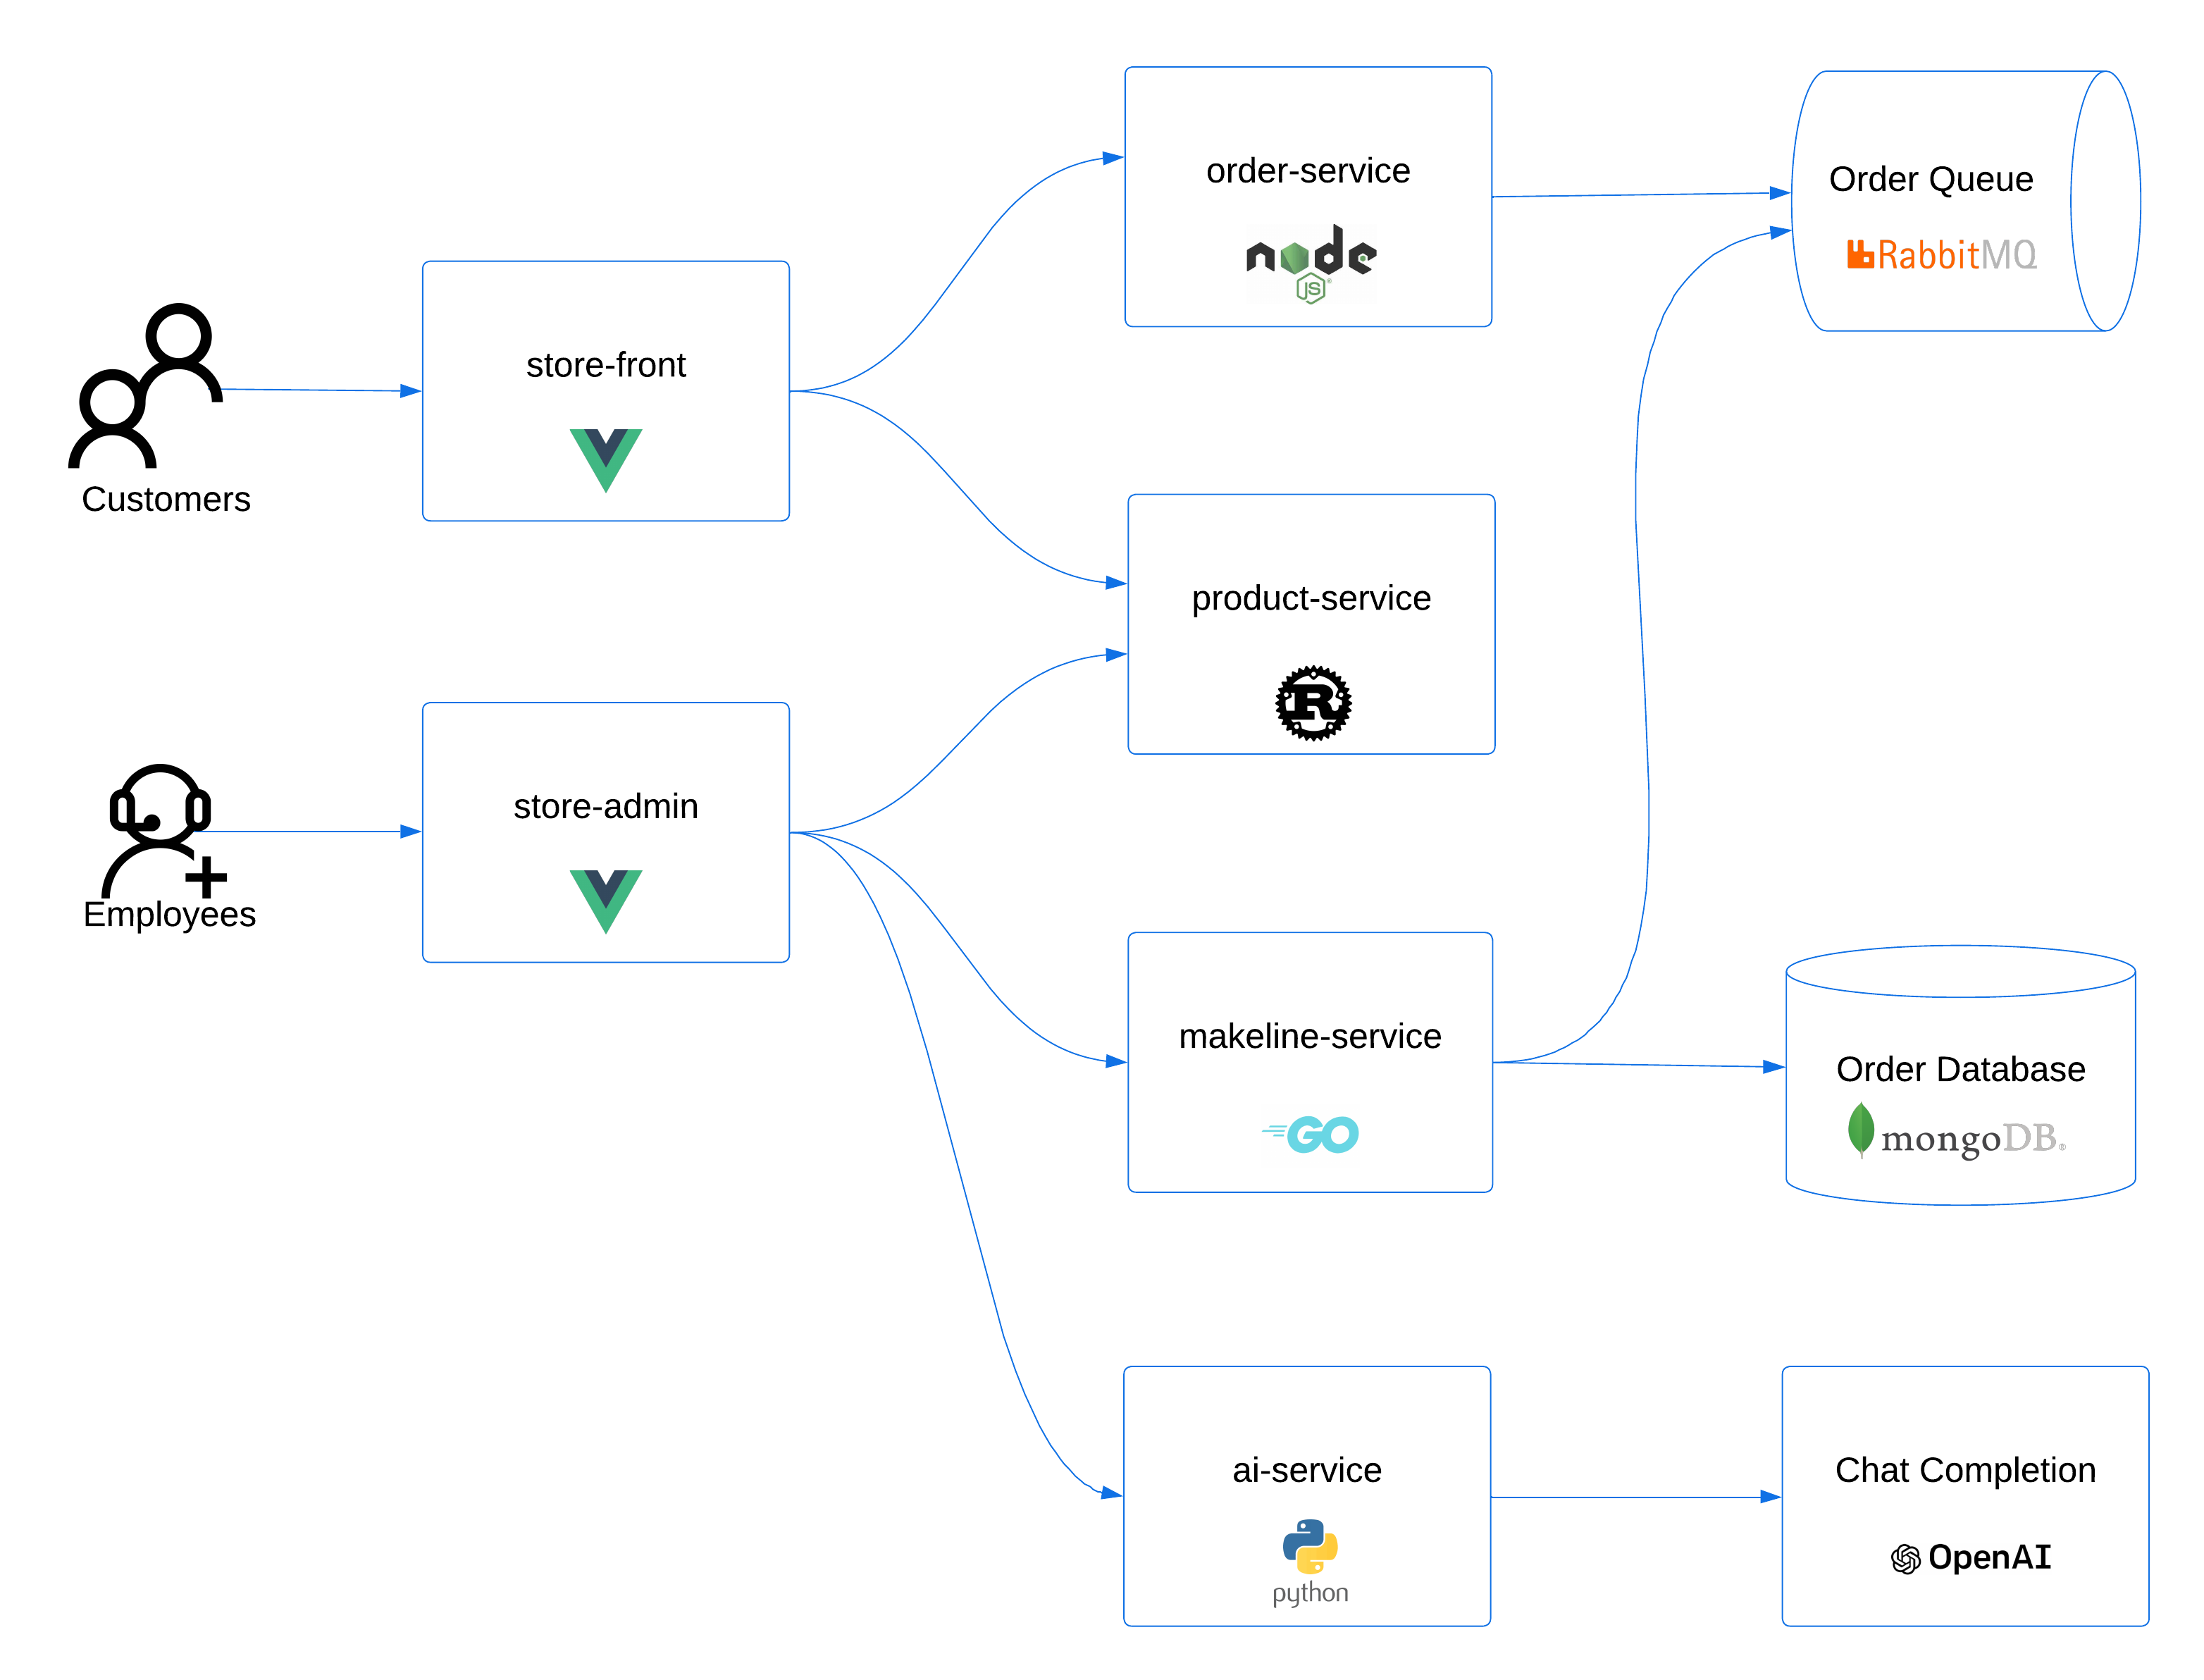 Select here for more information on the architecture of the AKS Store application.
Steps to deploy the AKS Store application on the cluster:
- Deploy the Application
# Create the pet store namespace
kubectl create ns pets

# Deploy the pet store components to the pets namespace
kubectl apply -f https://raw.githubusercontent.com/Azure-Samples/aks-store-demo/main/aks-store-all-in-one.yaml -n pets
- Check the deployment status
kubectl get pods -n pets
Expected output
NAME                                READY   STATUS    RESTARTS   AGE
makeline-service-6c8ffb5857-gnrv7   1/1     Running   0          76s
mongodb-0                           1/1     Running   0          77s
order-service-595b65df56-xjtrr      1/1     Running   0          76s
product-service-5b8794b597-trbvn    1/1     Running   0          75s
rabbitmq-0                          1/1     Running   0          76s
store-admin-5588c957-hc4qw          1/1     Running   0          74s
store-front-6ff78d4f79-6mwx9        1/1     Running   0          75s
virtual-customer-f5d4cd9f7-2sb7w    1/1     Running   0          74s
virtual-worker-865bcdf78f-jp9vk     1/1     Running   0          74s
Enforcing Network Policy
In this section, we'll apply network policies to control traffic flow to and from the Pet Shop application. We will start with standard network policy that doesn't require ACNS, then we enforce more advanced FQDN policies.
Test Connectivity
Do the following test to make sure that all traffic is allowed by default
Run the following command to test a connection to an external website from the order-service pod.
kubectl exec -n pets -it $(kubectl get po -n pets -l app=order-service -ojsonpath='{.items[0].metadata.name}') -c order-service -- sh -c 'wget --spider www.bing.com'
You should see output similar to the following:
Connecting to www.bing.com (13.107.21.237:80)
remote file exists
Now test the connection between the order-service and product-service pods which is allowed but not required by the architecture.
kubectl exec -n pets -it $(kubectl get po -n pets -l app=order-service -ojsonpath='{.items[0].metadata.name}') -c order-service -- sh -c 'nc -zv -w2 product-service 3002'
You should see output similar to the following:
product-service (10.0.96.101:3002) open
In both tests, the connection was successful. This is because all traffic is allowed by default in Kubernetes.
Deploy Network Policy
Now, let's deploy some network policy to allow only the required ports in the pets namespace.
Run the following command to download the network policy manifest file.
curl -o acns-network-policy.yaml https://raw.githubusercontent.com/Azure-Samples/aks-labs/refs/heads/main/docs/networking/assets/acns-network-policy.yaml
Optionally, take a look at the network policy manifest file by running the following command.
cat acns-network-policy.yaml
Apply the network policy to the pets namespace.
kubectl apply -n pets -f acns-network-policy.yaml
Verify Policies
Review the created policies using the following command
kubectl get cnp -n pets
Ensure that only allowed connections succeed and others are blocked. For example, order-service should not be able to access www.bing.com or the product-service.
Run the following command to test the connection to www.bing.com from the order-service pod.
kubectl exec -n pets -it $(kubectl get po -n pets -l app=order-service -ojsonpath='{.items[0].metadata.name}') -c order-service -- sh -c 'wget --spider --timeout=1 --tries=1 www.bing.com'
You should see output similar to the following:
wget: bad address 'www.bing.com'
command terminated with exit code 1
Run the following command to test the connection between the order-service and product-service pods.
kubectl exec -n pets -it $(kubectl get po -n pets -l app=order-service -ojsonpath='{.items[0].metadata.name}') -c order-service -- sh -c 'nc -zv -w2 product-service 3002'
You should see output similar to the following:
nc: bad address 'product-service'
command terminated with exit code 1
We've just enforced network policies to control traffic flow to and from pods within the demo application. At the same time, we should be able to access the pet shop app UI and order product normally.
Configuring FQDN Filtering
Using network policies, you can control traffic flow to and from your AKS cluster. This is traditionally been enforced based on IP addresses and ports. But what if you want to control traffic based on fully qualified domain names (FQDNs)? What if an application owner asks you to allow traffic to a specific domain like Microsoft Graph API?
This is where FQDN filtering comes in.
FQDN filtering is only available for clusters using Azure CNI Powered by Cilium.
Let's explore how we can apply FQDN-based network policies to control outbound access to specific domains.
Test Connectivity
Let's start with testing the connection from the order-service to see if it can contact the Microsoft Graph API endpoint.
Run the following command to test the connection to the Microsoft Graph API from the order-service pod.
kubectl exec -n pets -it $(kubectl get po -n pets -l app=order-service -ojsonpath='{.items[0].metadata.name}') -c order-service -- sh -c 'wget --spider --timeout=1 --tries=1 https://graph.microsoft.com'
As you can see the traffic is denied. This is an expected behavior because we have implemented zero trust security policy and denying any unwanted traffic.
Create an FQDN Policy
To limit egress to certain domains, apply an FQDN policy. This policy permits access only to specified URLs, ensuring controlled outbound traffic.
FQDN filtering requires ACNS to be enabled
Run the following command to download the FQDN policy manifest file.
curl -o acns-network-policy-fqdn.yaml https://raw.githubusercontent.com/Azure-Samples/aks-labs/refs/heads/main/docs/networking/assets/acns-network-policy-fqdn.yaml
Optionally, take a look at the FQDN policy manifest file by running the following command.
cat acns-network-policy-fqdn.yaml
Apply the FQDN policy to the pets namespace.
kubectl apply -n pets -f acns-network-policy-fqdn.yaml
Verify FQDN Policy Enforcement
Now if we try to access Microsoft Graph API from order-service app, that should be allowed.
kubectl exec -n pets -it $(kubectl get po -n pets -l app=order-service -ojsonpath='{.items[0].metadata.name}') -c order-service -- sh -c 'wget --spider --timeout=1 --tries=1 https://graph.microsoft.com'
You should see output similar to the following:
Connecting to graph.microsoft.com (20.190.152.88:443)
Connecting to developer.microsoft.com (23.45.149.11:443)
Connecting to developer.microsoft.com (23.45.149.11:443)
remote file exists
Detect Network Issues with Grafana Dashboards
ACNS provides comprehensive network visibility by logging all pod communications, enabling you to investigate connectivity issues over time. Using Azure Managed Grafana, you can visualize real-time traffic patterns, performance metrics, and policy effectiveness.
Let's simulate a network problem and then use Grafana dashboards to detect the issue — just as you would in a production monitoring workflow.
Introduce Chaos to Test Container Networking
Let's start by applying a new network policy to cause some chaos in the network. This policy will drop incoming traffic to the store-front service.
Run the following command to download the chaos policy manifest file.
curl -o acns-network-policy-chaos.yaml https://raw.githubusercontent.com/Azure-Samples/aks-labs/refs/heads/main/docs/networking/assets/acns-network-policy-chaos.yaml
Optionally, examine the chaos policy manifest file by running the following command.
cat acns-network-policy-chaos.yaml
Run the following command to apply the chaos policy to the pets namespace.
kubectl apply -n pets -f acns-network-policy-chaos.yaml
Access Your Grafana Instance
Now let's see how Grafana dashboards surface the issue you just created.
- Open the Azure Portal and navigate to your AKS cluster
- In the left navigation pane, Select Dashboards with Grafana
- Select your Azure Managed Grafana instance
- Navigate to Dashboards → Browse → Azure / Kubernetes / Networking
Explore ACNS Metrics Dashboards
ACNS provides pre-built dashboards for real-time network observability:
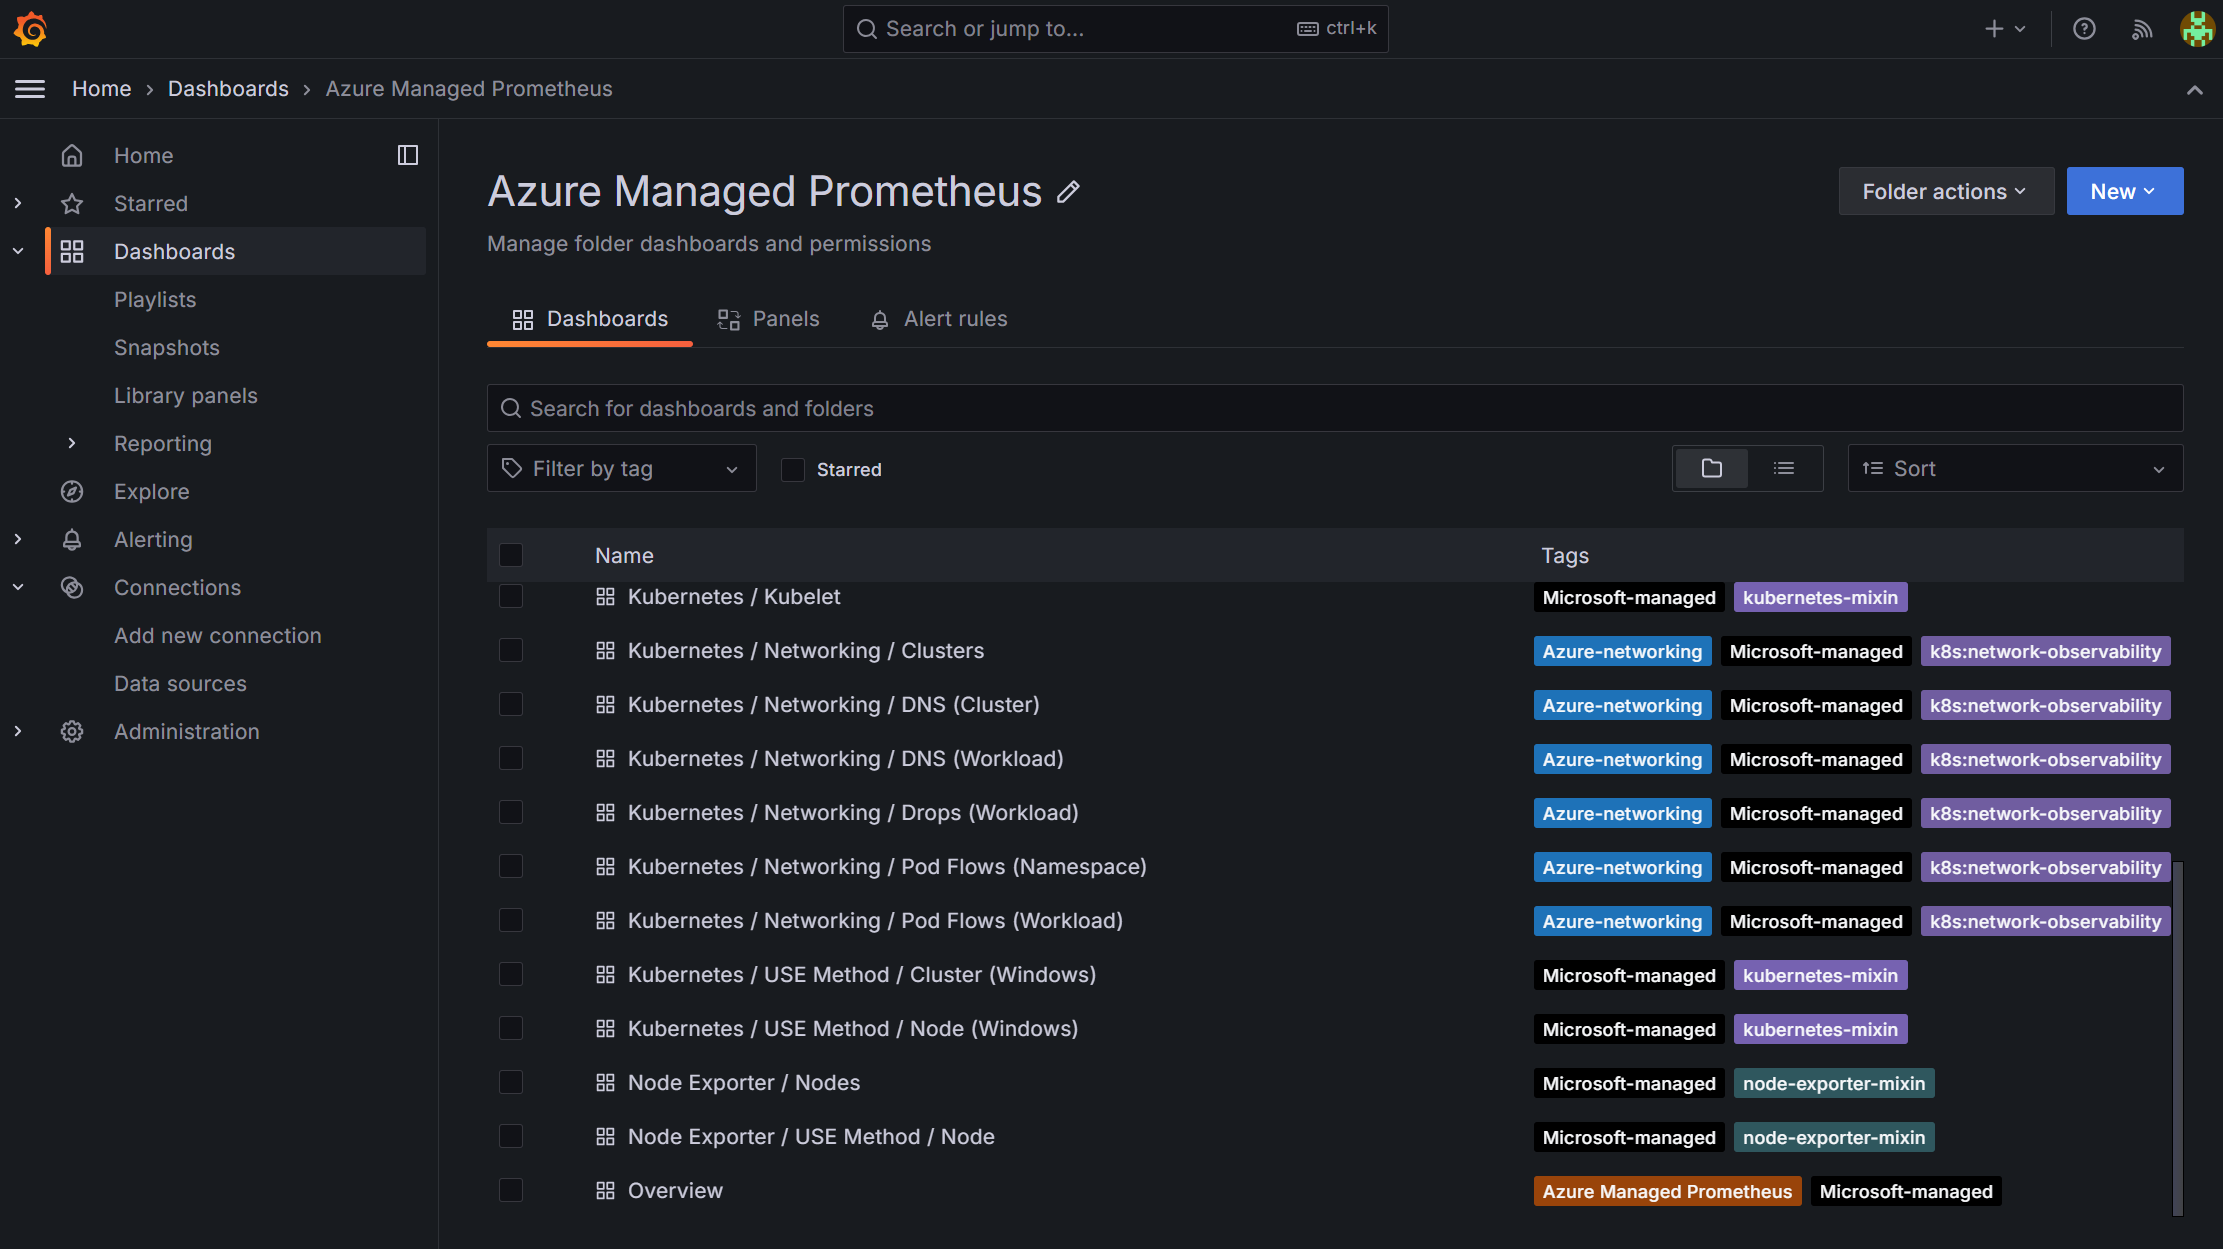
Available Metrics Dashboards:
- Kubernetes / Networking / Clusters - Cluster-wide traffic overview
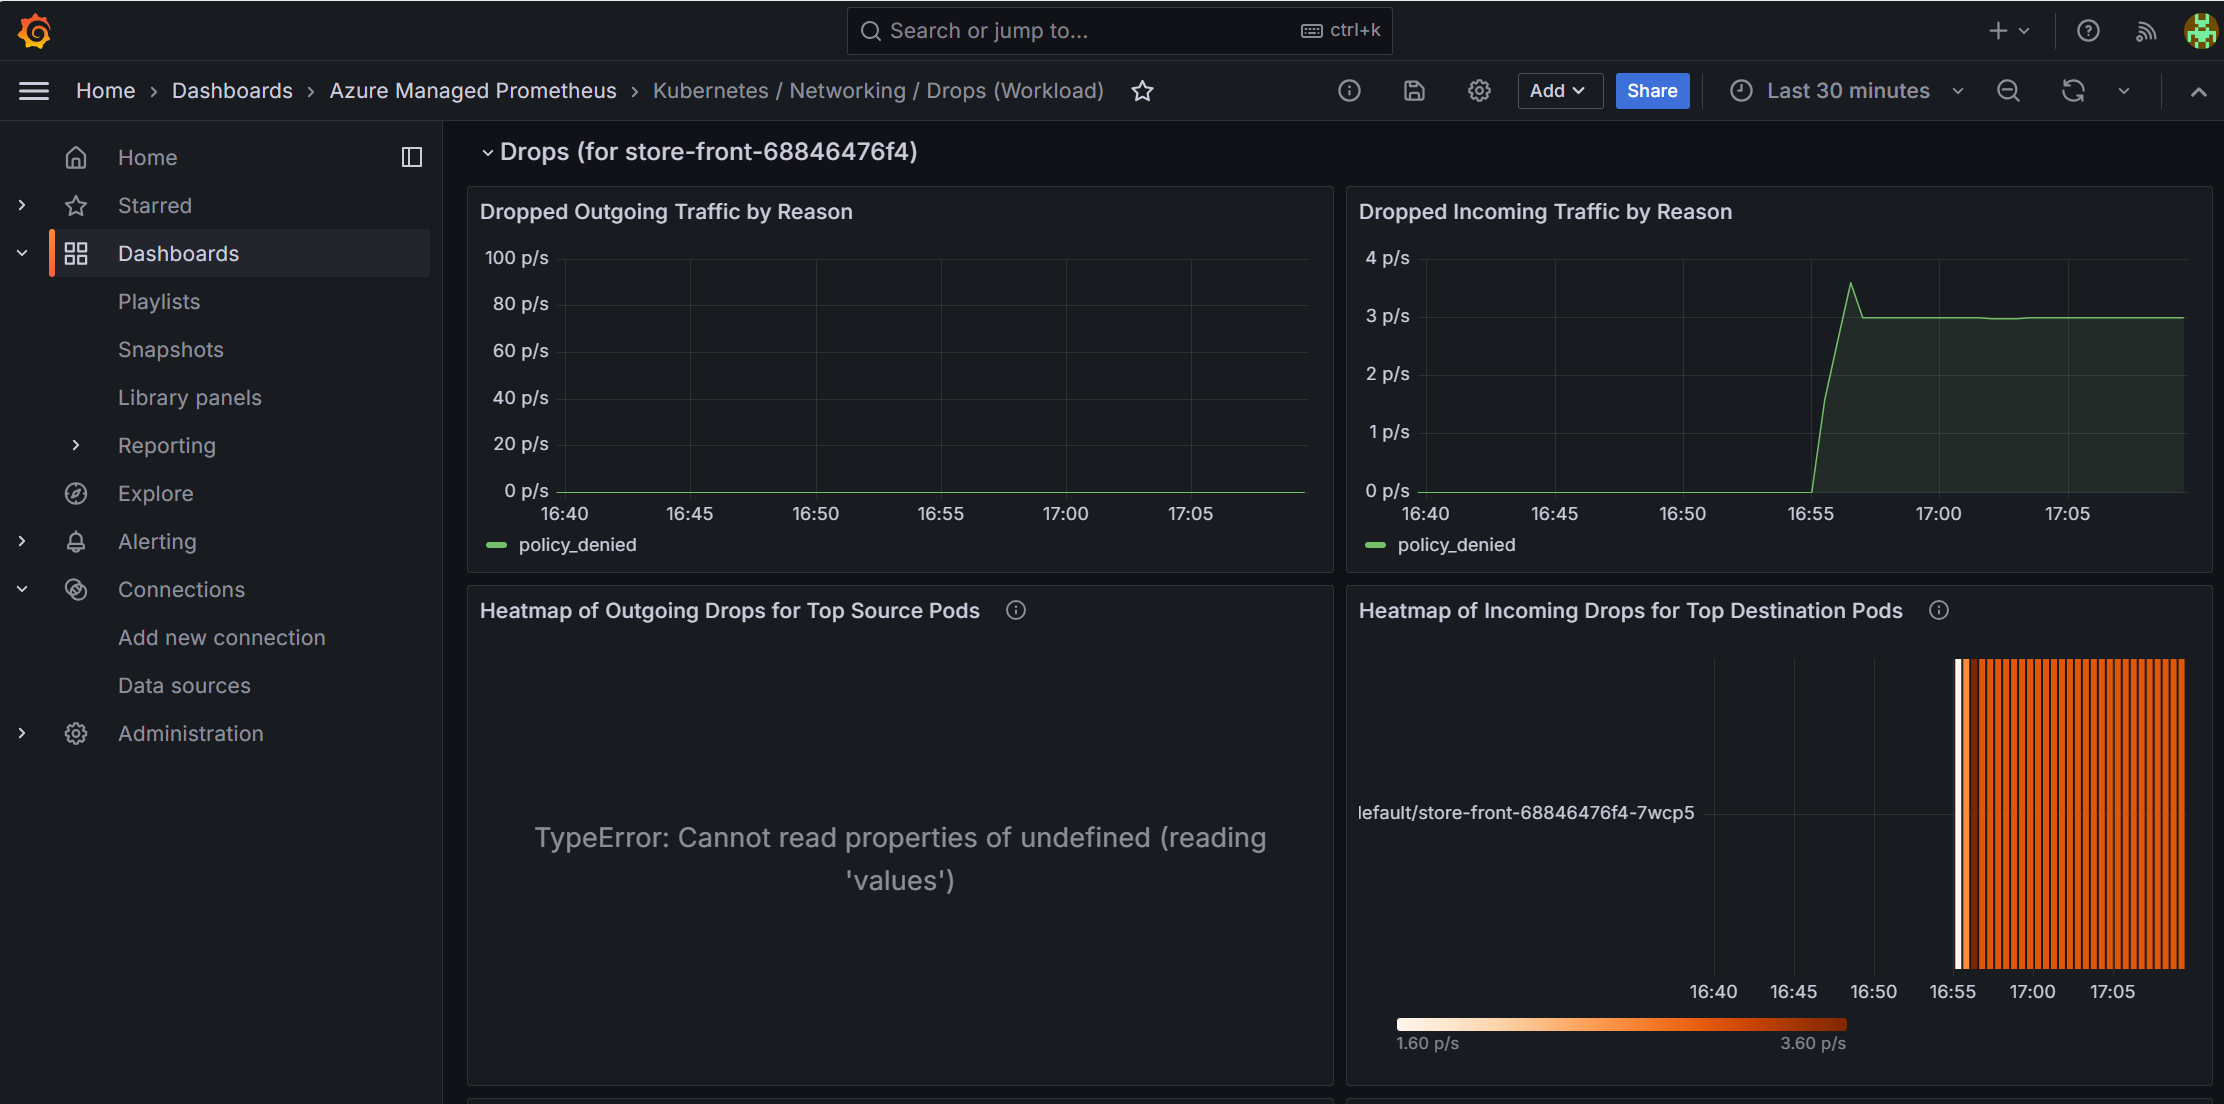
- Kubernetes / Networking / Drops - Dropped packet analysis
- Filter by Namespace: pets
- Filter by Workload: store-front
- Observe dropped incoming traffic with reason "policy_denied"
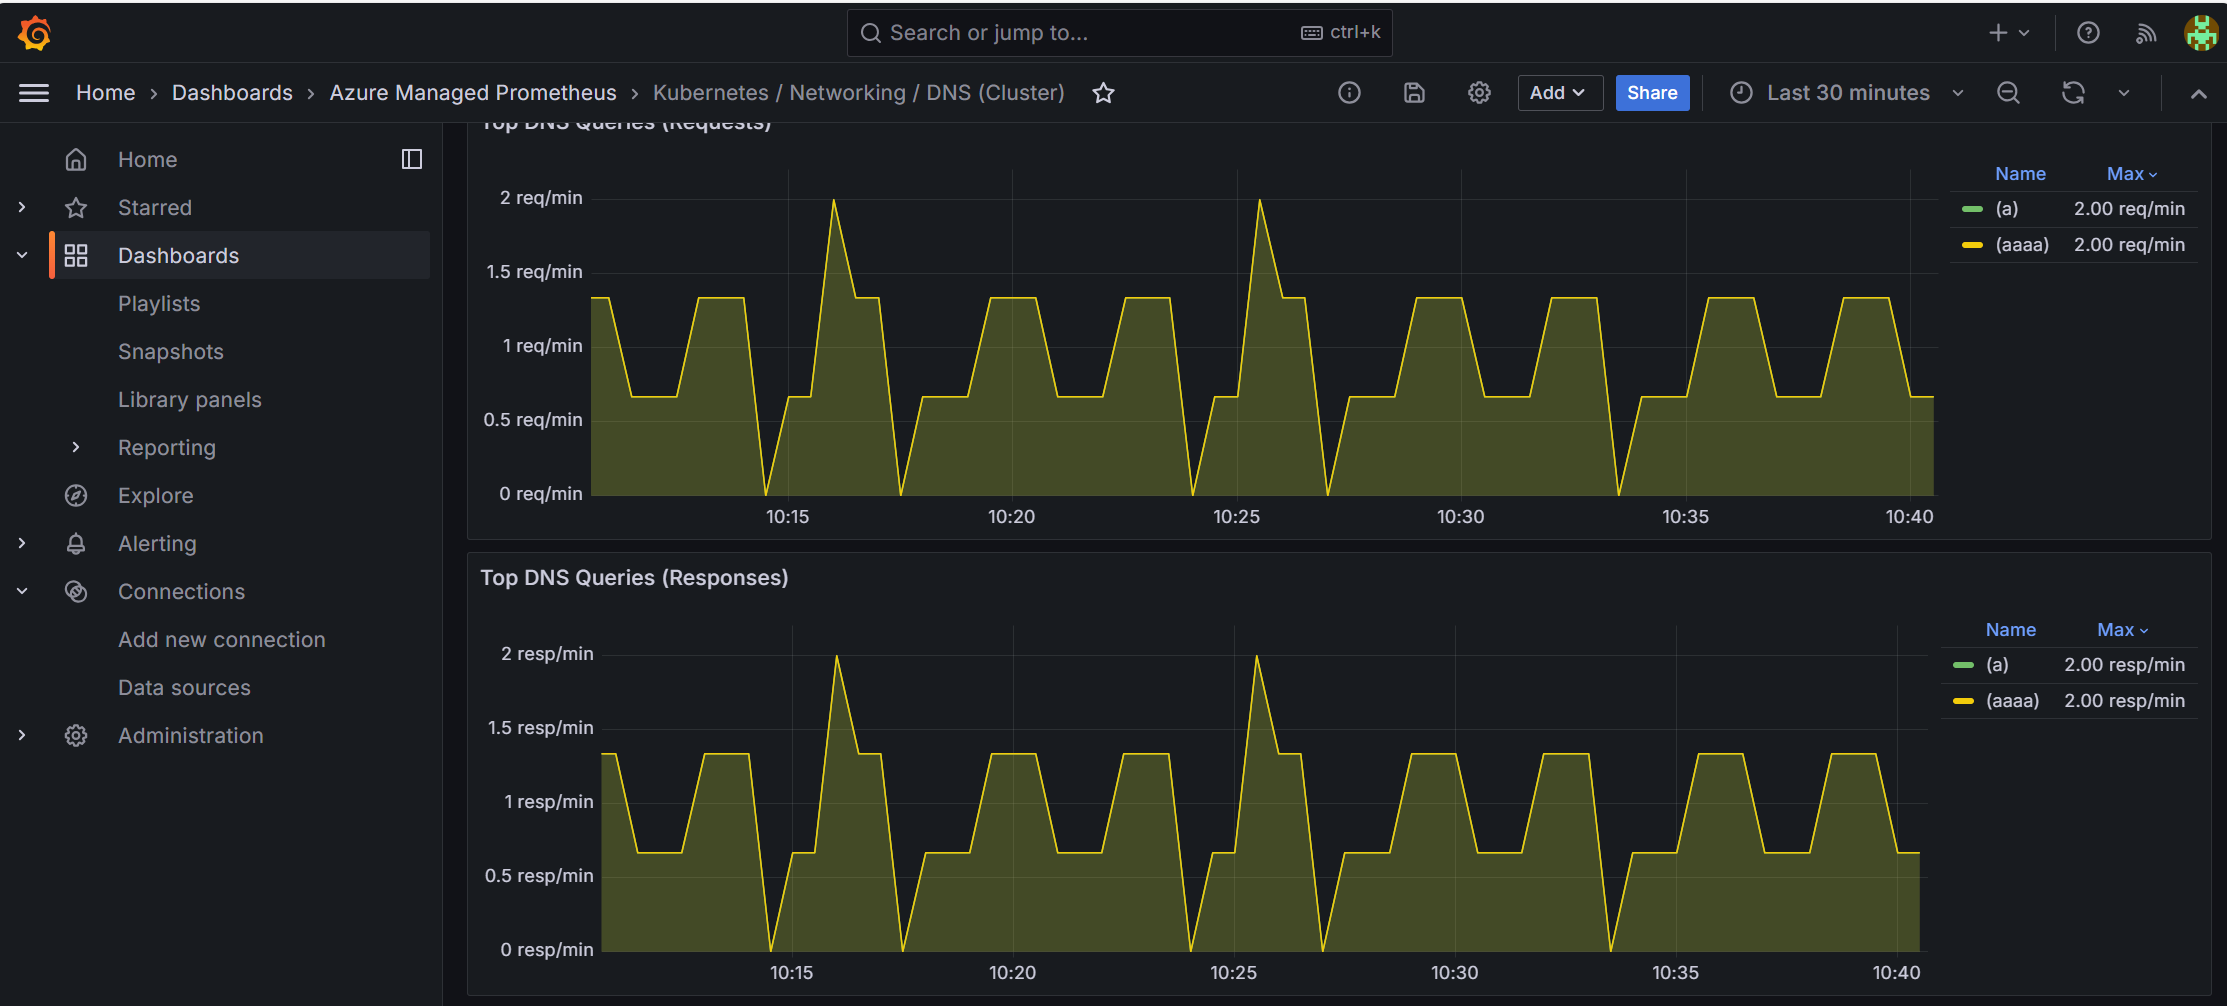
- Kubernetes / Networking / DNS - DNS query statistics
- Kubernetes / Networking / Pod Flows - Service mesh traffic patterns
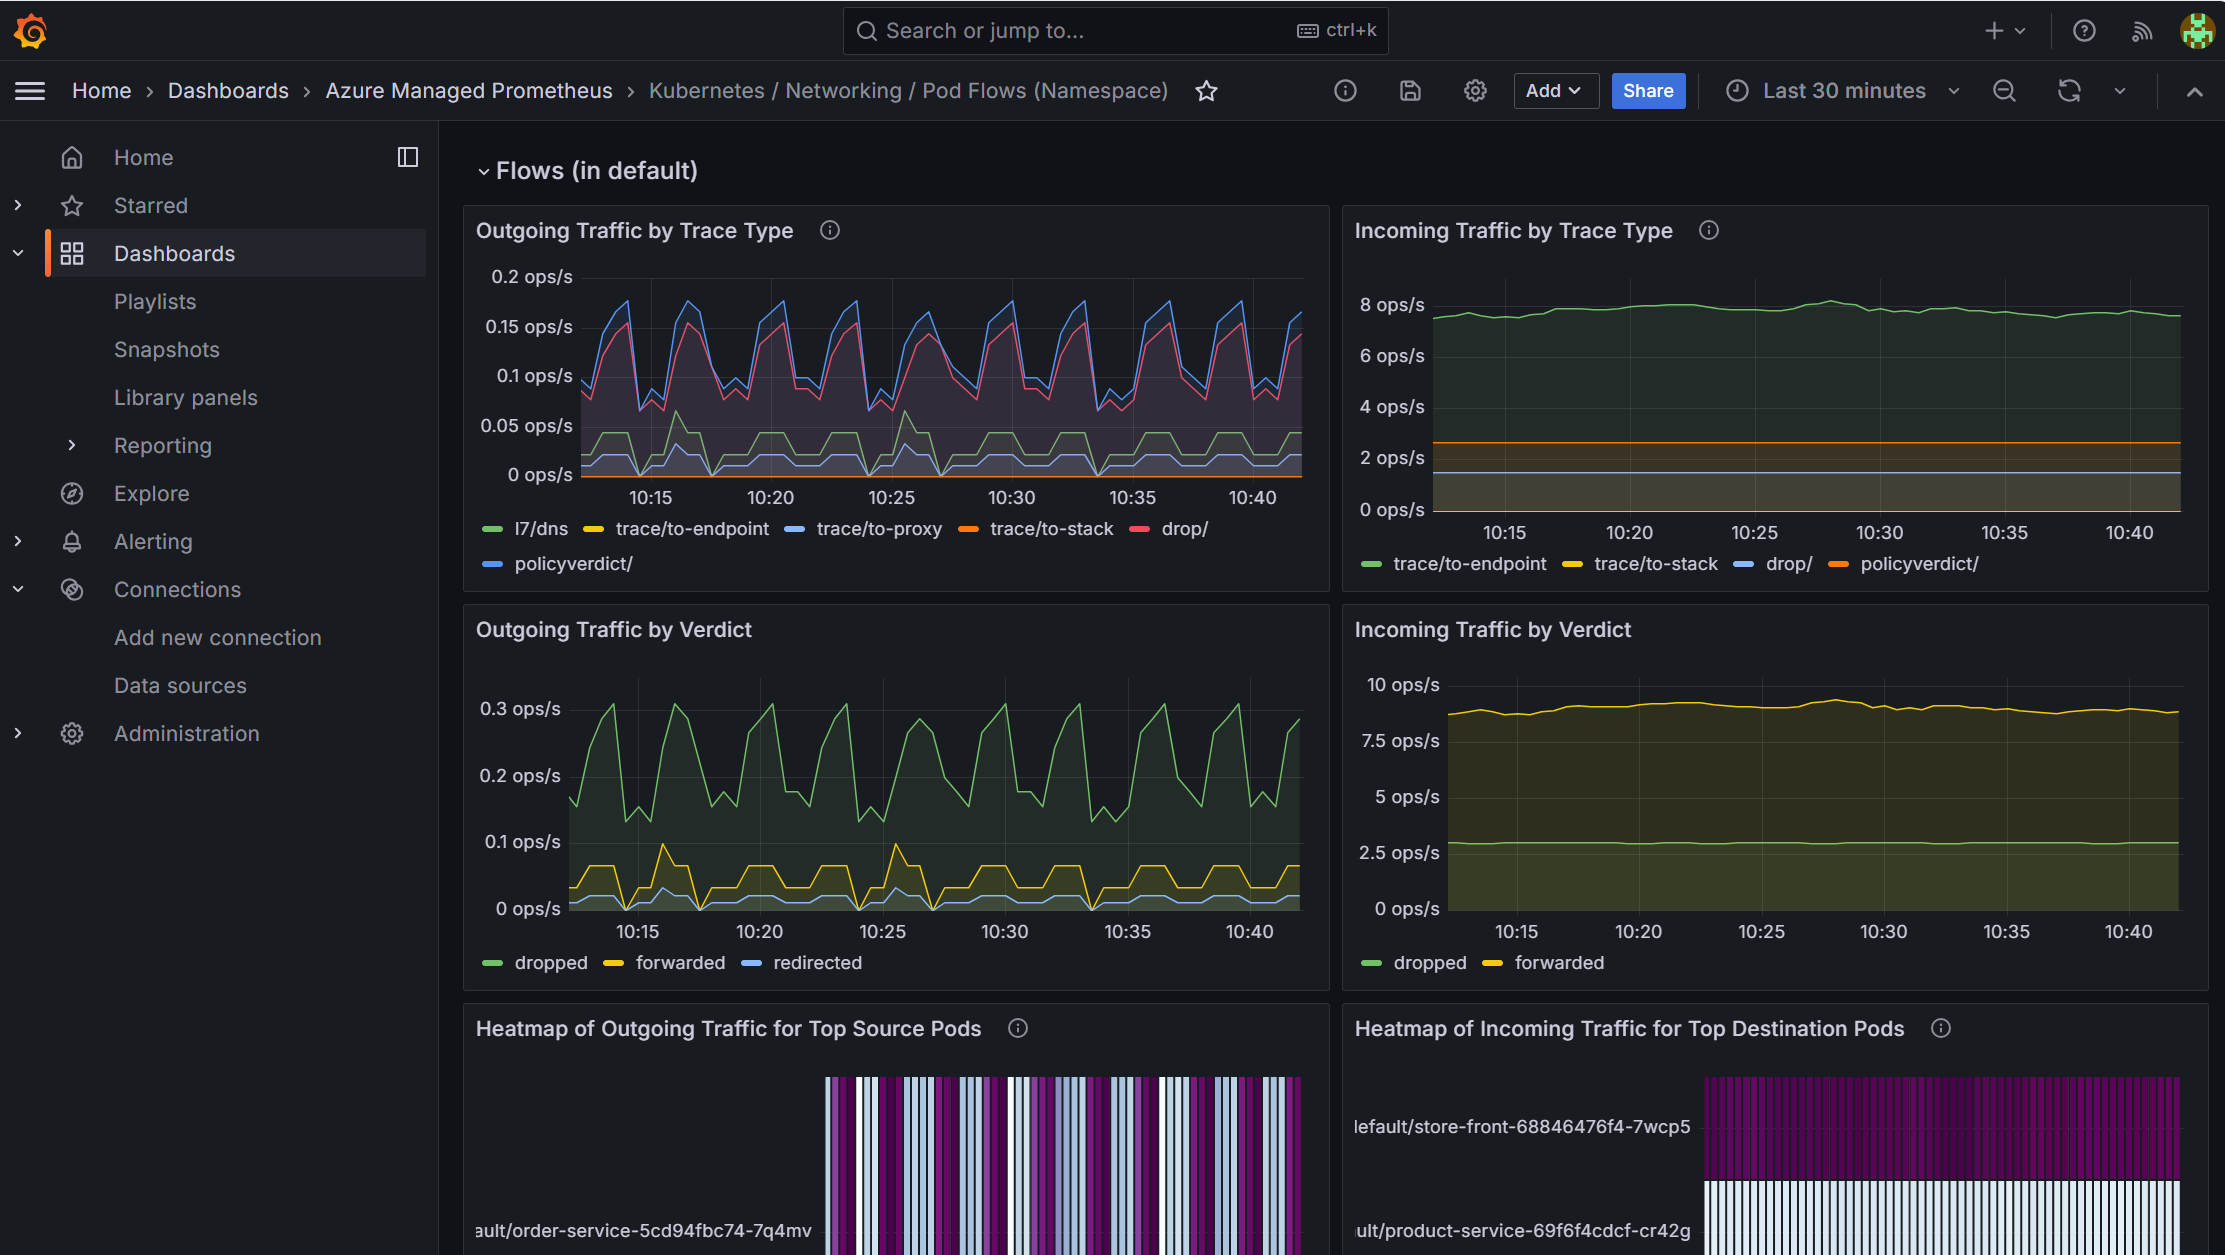
What Metrics Dashboards Show:
- Real-time aggregated traffic statistics
- Dropped packet trends and reasons
- DNS query success/failure rates
- Service-to-service communication patterns
- Network policy effectiveness
When to Use Metrics Dashboards:
- Detection: Identify when problems start occurring
- Monitoring: Track cluster health in real-time
- Alerting: Set up alerts based on drop rates or latency
- High-level insights: Understand traffic patterns at a glance
The ACNS Way: Smart Observability at Low Cost
ACNS delivers high observability at low cost by combining targeted metrics collection with detailed flow logs. Instead of collecting everything, you'll learn how to cut the noise and cut the cost — retaining full visibility into what matters while filtering out expensive, low-value data.
Next, you'll use Container Network Flow Logs for detailed forensic analysis of network traffic over time.
Leverage Container Network Flow Logs for Faster Troubleshooting
- Who is being blocked (which specific source IPs or clients)
- Why DNS queries fail for specific domains
- When exactly the problem started affecting individual flows
- What external endpoints are failing vs succeeding
This is where Container Network Flow Logs accelerate your troubleshooting. Think of metrics as the "smoke alarm" and flow logs as the "security camera footage" - metrics alert you to the problem, while flow logs show you exactly what happened.
The Traditional Troubleshooting Approach (Without Flow Logs):
- SSH into individual nodes to check iptables rules (risky in production)
- Enable debug logging on pods (requires restarts, loses existing state)
- Manually test connections one-by-one to isolate the issue
- Correlate timestamps across multiple pod logs to understand traffic patterns
- Estimated time: 2-4 hours for a complex network policy issue
With Container Network Flow Logs (What You'll Do Next):
- Run a single KQL query to see exact blocked connections with source IPs
- Query DNS traffic to identify which domains are allowed vs blocked
- Correlate DNS success with connection failures in one view
- Visualize traffic patterns over time to pinpoint when the issue started
- Estimated time: 10-15 minutes to fully diagnose the root cause
Let's see this in action by investigating the issues developers reported.
Enable Flow Logs for the Pets Namespace
To enable container network flow logs, you need to apply a ContainerNetworkLog custom resource that defines which network flows to capture. Let's create a filter to capture all traffic in the pets namespace.
Apply the custom resource to enable flow log collection:
kubectl apply -f - <<'EOF'
apiVersion: acn.azure.com/v1alpha1
kind: ContainerNetworkLog
metadata:
  name: testcnl # Cluster scoped
spec:
  includefilters: # List of filters
    - name: egress-filter # Capture egress traffic from pets namespace
      from:
        namespacedPod: # List of source namespace/pods. Prepend namespace with /
          - pets/order-service-
          - pets/product-service-
          - pets/rabbitmq
          - pets/store-front-
          - kube-system/core-dns-
      protocol: # List of protocols; can be tcp, udp, dns
        - tcp
        - udp
        - dns
      verdict: # List of verdicts; can be forwarded, dropped
        - forwarded
        - dropped

    - name: ingress-filter # Capture ingress traffic to pets namespace
      to:
        namespacedPod: # Destination pods
          - pets/store-front-
          - pets/order-service-
          - pets/product-service-
          - pets/rabbitmq
          - kube-system/core-dns-
      protocol:
        - tcp
        - udp
      verdict:
        - forwarded
        - dropped
EOF
Verify the custom resource was created successfully:
kubectl describe containernetworklog testcnl
You should see a Status field showing State: CONFIGURED. This means flow logs are now being collected for the pets namespace and sent to your Log Analytics workspace.
Generate Traffic to Observe Flow Logs
Flow logs are stored locally on the nodes at /var/log/acns/hubble/events.log and then collected by the Azure Monitor Agent and sent to Log Analytics. It may take 2-3 minutes for logs to appear in Log Analytics after network events occur.
This policy adds FQDN filtering and L7 HTTP rules to the store-front application:
apiVersion: cilium.io/v2
kind: CiliumNetworkPolicy
metadata:
  name: combined-fqdn-l7-policy
  namespace: pets
spec:
  endpointSelector:
    matchLabels:
      app: store-front

  # BLOCK ALL INGRESS TRAFFIC
  ingress: []  # Empty ingress = block all incoming traffic

  egress:
  # 1. Allow DNS to kube-dns (only for specific domains)
  - toEndpoints:
    - matchLabels:
        k8s:io.kubernetes.pod.namespace: kube-system
        k8s:k8s-app: kube-dns
    toPorts:
    - ports:
      - port: "53"
        protocol: ANY
      rules:
        dns:
          - matchPattern: "rabbitmq.pets.svc.cluster.local"
          - matchPattern: "*.microsoft.com"
          - matchPattern: "*.microsoft.com.cluster.local"
          - matchPattern: "*.microsoft.com.pets.svc.cluster.local"
          - matchPattern: "*.microsoft.com.*.*.internal.cloudapp.net"
          - matchPattern: "*.microsoft.com.svc.cluster.local"
          - matchPattern: "*.pets.svc.cluster.local"
          - matchPattern: "*.svc.cluster.local"
          # NOTE: api.github.com, google.com, and bing.com are NOT in DNS rules
          # This will cause DNS queries to fail for these domains

  # 2. Allow both HTTP and HTTPS to *.microsoft.com (FQDN filtering)
  - toFQDNs:
    - matchPattern: "*.microsoft.com"
    toPorts:
    - ports:
      - port: "80"
        protocol: TCP
      - port: "443"
        protocol: TCP

  # 3. Allow HTTPS to api.github.com (but DNS will fail - see note above)
  # This demonstrates a common misconfiguration: toFQDNs without DNS rules
  - toFQDNs:
    - matchName: api.github.com
    toPorts:
    - ports:
      - port: "443"
        protocol: TCP

  # 4. Allow internal backend communication with L7 HTTP rules
  - toEndpoints:
    - matchLabels:
        app: product-service
    toPorts:
    - ports:
      - port: "3002"
        protocol: TCP
      rules:
        http:
        - method: "GET"
          path: "/"
Run the following command to download the combined FQDN and L7 policy manifest file.
curl -o aks-combined-fqdn-l7.yaml https://raw.githubusercontent.com/Azure-Samples/aks-labs/refs/heads/main/docs/networking/assets/aks-combined-fqdn-l7.yaml
Optionally, review the policy to understand what traffic it allows:
cat aks-combined-fqdn-l7.yaml
Run the following command to apply the combined FQDN and L7 policy to the pets namespace.
kubectl apply -n pets -f aks-combined-fqdn-l7.yaml
Step 2: Generate Test Traffic (Individual Scenarios)
Now let's generate test traffic for each scenario individually so you can observe the results step by step.
Scenario 1: Test External Access to Store-Front
This tests whether external users can access the store-front application.
STORE_FRONT_IP=$(kubectl get svc -n pets store-front -o jsonpath='{.status.loadBalancer.ingress[0].ip}')
echo "Testing external access to store-front at ${STORE_FRONT_IP}..."
curl -s -m 2 http://${STORE_FRONT_IP} || echo "Connection failed"
Expected Result:
Connection failed
Why? The chaos policy blocks ALL ingress traffic with ingress: - fromEndpoints: [] (allow from nowhere = block all)
Scenario 2: Test FQDN Access to microsoft.com (Allowed Domain)
This tests access to a domain that is in BOTH the DNS patterns AND toFQDNs list.
echo "Testing FQDN access to microsoft.com..."
kubectl exec -n pets -it $(kubectl get po -n pets -l app=store-front -ojsonpath='{.items[0].metadata.name}') -- sh -c 'wget --spider --timeout=2 https://www.microsoft.com'
Expected Result:
Connecting to www.microsoft.com (23.192.18.101:443)
wget: server returned error: HTTP/1.1 403 Forbidden
Why? The network policy allows the connection (DNS query succeeds, HTTPS connection succeeds), but the Microsoft web server returns HTTP 403. This proves the FQDN policy is working correctly - the network allows the traffic through.
Scenario 3: Test FQDN Access to api.github.com (DNS Blocked)
This tests access to a domain that is in the toFQDNs list but NOT in the DNS patterns - demonstrating a common misconfiguration.
echo "Testing FQDN access to api.github.com..."
kubectl exec -n pets -it $(kubectl get po -n pets -l app=store-front -ojsonpath='{.items[0].metadata.name}') -- sh -c 'wget --spider --timeout=2 https://api.github.com'
Expected Result:
wget: bad address 'api.github.com'
command terminated with exit code 1
Why? Even though api.github.com is in the toFQDNs list, the DNS query itself is being blocked because api.github.com is NOT in the DNS matchPattern rules. The pod never gets to attempt the HTTPS connection.
Scenario 4: Test L7 HTTP Policy - Product Service API Access
This tests Layer 7 (HTTP) filtering which inspects the actual HTTP method and path, not just IP/port.
echo "Testing L7 HTTP access to product-service..."
kubectl exec -n pets -it $(kubectl get po -n pets -l app=store-front -ojsonpath='{.items[0].metadata.name}') -- sh -c 'wget --spider --timeout=2 http://product-service:3002/'
Expected Result:
Connecting to product-service:3002 (10.0.96.101:3002)
remote file exists
Why? The L7 HTTP policy allows GET requests to the / path on product-service. This demonstrates Layer 7 (application layer) filtering - the policy can inspect HTTP methods and paths, not just IP addresses and ports.
Now test a different HTTP method (POST) to the same endpoint:
echo "Testing L7 HTTP POST to product-service (should be blocked)..."
kubectl exec -n pets -it $(kubectl get po -n pets -l app=store-front -ojsonpath='{.items[0].metadata.name}') -- sh -c 'wget --timeout=2 --post-data="" http://product-service:3002/' || echo "Request blocked by L7 policy"
Expected Result:
Connecting to product-service:3002 (10.0.96.101:3002)
wget: server returned error: HTTP/1.1 403 Forbidden
Request blocked by L7 policy
Why? The L7 policy only allows GET requests. POST requests to the same endpoint are blocked at the application layer. This shows how L7 policies provide fine-grained control beyond traditional L3/L4 network policies.
Scenario 5: Test Internal Service-to-Service Communication
This tests that internal pod-to-pod communication works correctly within the namespace.
echo "Testing internal service communication (store-front to order-service)..."
kubectl exec -n pets -it $(kubectl get po -n pets -l app=store-front -ojsonpath='{.items[0].metadata.name}') -- sh -c 'nc -zv -w2 order-service 3000'
Expected Result:
order-service (10.0.96.102:3000) open
Why? The network policies allow internal communication between services in the pets namespace. This confirms that while external access is restricted and FQDN filtering is applied, internal service mesh communication remains functional.
Scenario 6: Test Internal DNS Resolution with Short Service Names
This tests that internal cluster DNS resolution works correctly with Kubernetes short service names.
echo "Testing DNS resolution with short service name..."
kubectl exec -n pets -it $(kubectl get po -n pets -l app=store-front -ojsonpath='{.items[0].metadata.name}') -- sh -c 'nslookup order-service'
Expected Result:
Server:    10.0.0.10
Address 1: 10.0.0.10 kube-dns.kube-system.svc.cluster.local

Name:      order-service
Address 1: 10.0.96.102 order-service.pets.svc.cluster.local
Why? The DNS query for order-service (short name) gets automatically expanded to order-service.pets.svc.cluster.local using the pod's DNS search domain. This demonstrates that internal cluster DNS resolution works correctly, even with the network policies in place. The DNS query matches the *.pets.svc.cluster.local pattern in the DNS rules, allowing successful name resolution.
Summary of Test Scenarios:
| Scenario | Test Type | Protocol/Layer | Result |
|---|---|---|---|
| 1 | External → store-front | L3/L4 (TCP/IP) | ❌ Ingress blocked by chaos policy |
| 2 | microsoft.com | L7 (HTTPS/FQDN) | ✅ Network OK (HTTP 403 from server) |
| 3 | api.github.com | L7 (DNS/FQDN) | ❌ DNS query blocked (missing from DNS patterns) |
| 4 | GET /api/products | L7 (HTTP method) | ✅ Allowed by L7 policy |
| 4b | POST /api/products | L7 (HTTP method) | ❌ Blocked by L7 policy (only GET allowed) |
| 5 | store-front → order-service | L3/L4 (TCP internal) | ✅ Internal communication works |
| 6 | nslookup order-service | DNS (internal) | ✅ Internal DNS resolution works |
What You Just Simulated:
- External Access Failures: The chaos policy is blocking all ingress traffic to store-front
- Selective FQDN Filtering: The FQDN policy allows
*.microsoft.com, but blocksapi.github.comat the DNS level - L7 HTTP Method Filtering: The L7 policy allows GET requests but blocks POST requests to the product-service API, demonstrating application-layer control
- Internal Service Mesh: Pod-to-pod communication within the namespace continues to work normally
For FQDN filtering to work in Cilium, you need both components working together:
- DNS rules (port 53) with
matchPattern- Allow the DNS query to resolve the domain name - toFQDNs rules - Allow the connection to the resolved IP address
Notice that api.github.com is in the toFQDNs list but still fails because it's missing from the DNS matchPattern rules. The DNS query gets blocked first, so the pod never attempts the actual connection. In contrast, *.microsoft.com works because it's in both sections. This is a common misconfiguration that container network flow logs help you identify quickly.
Traditional Troubleshooting vs. ACNS:
Without container network flow logs, you would need to SSH into nodes to check iptables rules, manually correlate pod events with network policies, and spend hours trying different combinations to find the root cause.
Container Network Flow Logs with Log Analytics:
Since Container Network Flow Logs are enabled with Log Analytics workspace, we have access to historical logs that allow us to analyze network traffic patterns over time. We can query these logs using the ContainerNetworkLogs table to perform detailed forensic analysis and troubleshooting.
Now that flow logs are being collected and we've generated traffic, let's investigate the issues in minutes instead of hours.
Navigate to Azure Portal, search for your AKS cluster, then select Logs in the left navigation menu under Monitoring. Close the Queries dialog if it appears.
First, run this query to see what fields are available in your flow logs:
ContainerNetworkLogs
| take 1
This will show you all available fields including dynamic properties that may not appear in the schema.
Progressive Diagnosis Using Flow Logs
Now let's use flow logs to diagnose all the issues we just generated. Each query builds on the previous one, giving you a complete picture of what's happening in your cluster.
About Query Results: The results shown in this lab are examples from a specific testing environment. Your actual results will be similar in structure and pattern, but will have different values for IP addresses, pod names, timestamps, and counts based on your specific cluster configuration and traffic patterns.
Query 1: Start with the Obvious - What's Being Blocked? (30 seconds)
First, let's get a high-level view of all dropped traffic in the pets namespace:
ContainerNetworkLogs
| where TimeGenerated > ago(30m)
| where SourceNamespace == "pets" or DestinationNamespace == "pets"
| where Verdict == "DROPPED"
| summarize
    DroppedFlows = count()
    by TrafficDirection, SourcePodName, DestinationPodName
| order by DroppedFlows desc
| take 20
What you'll discover:
TrafficDirection SourcePodName DestinationPodName DroppedFlows INGRESS (external) store-front-abc123 156 EGRESS store-front-abc123 (external) 35
Immediate insights (30 seconds):
- ✅ INGRESS to store-front has 156 dropped flows - This confirms users can't access the application
- ✅ EGRESS from store-front has 35 dropped flows - Some external API calls are being blocked
What we learned: There are TWO distinct problems:
- External users can't reach the app (INGRESS issue)
- The app can't reach some external services (EGRESS issue)
Next step: We need to dig deeper into BOTH issues. Let's start with the INGRESS problem.
Query 2: Diagnose the INGRESS Problem - Who's Being Blocked? (1 minute)
Now let's see exactly which external connections are being dropped:
ContainerNetworkLogs
| where TimeGenerated > ago(30m)
| where DestinationNamespace == "pets"
| where DestinationPodName contains "store-front"
| where TrafficDirection == "INGRESS"
| where Verdict == "DROPPED"
| extend SrcIP = tostring(IP.source), DstIP = tostring(IP.destination)
| extend Layer4Data = parse_json(Layer4)
| extend DstPort = coalesce(tostring(Layer4Data.TCP.destination_port), tostring(Layer4Data.UDP.destination_port))
| project TimeGenerated, SrcIP, DstIP, DstPort, Verdict
| order by TimeGenerated desc
| take 20
What you'll discover:
| TimeGenerated | SrcIP | DstIP | DstPort | Verdict |
|---|---|---|---|---|
| 2024-11-04 10:25:18 | 203.0.113.45 | 10.0.96.101 | 80 | DROPPED |
| 2024-11-04 10:25:19 | 203.0.113.45 | 10.0.96.101 | 80 | DROPPED |
| 2024-11-04 10:25:20 | 203.0.113.45 | 10.0.96.101 | 80 | DROPPED |
Cumulative insights (90 seconds total):
- ✅ Exact source IPs of blocked external users (203.0.113.45 = your test machine)
- ✅ Destination port 80 confirms HTTP traffic is being blocked
- ✅ All INGRESS traffic to store-front is DROPPED - complete outage for external users
Root cause for INGRESS: The chaos policy has ingress: - fromEndpoints: [] (allow from nowhere = block all ingress)
Next step: INGRESS problem understood. Now let's diagnose the EGRESS issue - why are some external API calls failing?
Query 3: Diagnose EGRESS - Separate DNS Failures from Connection Failures (2 minutes)
Let's look at DNS traffic (port 53) to understand which domains are allowed vs blocked:
ContainerNetworkLogs
| where TimeGenerated > ago(30m)
| where SourceNamespace == "pets"
| where SourcePodName contains "store-front"
| where TrafficDirection == "EGRESS"
| extend Layer4Data = parse_json(Layer4)
| extend DstPort = coalesce(tostring(Layer4Data.TCP.destination_port), tostring(Layer4Data.UDP.destination_port))
| where DstPort == "53"  // DNS port
| summarize
    Count = count()
    by Verdict
| order by Verdict asc
What you'll discover:
| Verdict | Count |
|---|---|
| DROPPED | 15 |
| FORWARDED | 12 |
Cumulative insights (3 minutes total):
- ✅ 12 DNS queries succeeded (microsoft.com, internal cluster DNS)
- ✅ 15 DNS queries blocked (api.github.com, google.com, bing.com)
- ✅ Pattern identified: DNS is being selectively filtered
Key insight: Some domains fail at the DNS level - they never even get to attempt the HTTPS connection. This suggests the DNS matchPattern rules are too restrictive.
Next step: Let's see the complete picture - which domains are allowed and which are blocked, including both DNS and HTTPS traffic.
Query 4: Complete Traffic Pattern - DNS + HTTPS Correlation (2 minutes)
Now let's correlate DNS queries with HTTPS connection attempts to understand the full flow:
ContainerNetworkLogs
| where TimeGenerated > ago(30m)
| where SourceNamespace == "pets"
| where SourcePodName contains "store-front"
| where TrafficDirection == "EGRESS"
| extend SrcIP = tostring(IP.source), DstIP = tostring(IP.destination)
| extend Layer4Data = parse_json(Layer4)
| extend DstPort = coalesce(tostring(Layer4Data.TCP.destination_port), tostring(Layer4Data.UDP.destination_port))
| where DstPort in ("53", "443")  // DNS and HTTPS
| where isnotempty(DstIP)
| project TimeGenerated, DstIP, DstPort, Verdict
| order by TimeGenerated asc
| take 50
What you'll discover (showing key patterns):
| TimeGenerated | DstIP | DstPort | Verdict | Explanation |
|---|---|---|---|---|
| 10:26:10 | 10.0.0.10 | 53 | FORWARDED | DNS: microsoft.com |
| 10:26:11 | 23.192.18.101 | 443 | FORWARDED | HTTPS: Connection to microsoft.com succeeds |
| 10:26:15 | 10.0.0.10 | 53 | **DROPPED** | DNS: api.github.com blocked |
| 10:26:20 | 10.0.0.10 | 53 | **DROPPED** | DNS: google.com blocked |
| 10:26:25 | 10.0.0.10 | 53 | **DROPPED** | DNS: bing.com blocked |
| 10:26:30 | 10.0.0.10 | 53 | FORWARDED | DNS: rabbitmq.pets.svc.cluster.local |
Cumulative insights:
For microsoft.com (✅ Working):
- Step 1: DNS query to 10.0.0.10 port 53 → FORWARDED
- Step 2: HTTPS connection to 23.192.18.101 port 443 → FORWARDED
- Result: Network allows traffic (HTTP 403 from server is expected)
For api.github.com, google.com, bing.com (❌ Failing):
- Step 1: DNS query to 10.0.0.10 port 53 → DROPPED
- Step 2: HTTPS connection → Never attempted (DNS failed first)
- Result: "bad address" error
Root cause confirmed: The FQDN policy is missing these domains from the DNS matchPattern rules. Even though api.github.com is in the toFQDNs list, the DNS query gets blocked first.
Educational insight: This demonstrates a common FQDN policy misconfiguration - you need BOTH DNS rules AND toFQDNs rules for external access to work.
Next step: Let's visualize when these problems started with a timeline chart.
Query 5: Timeline - When Did the Problems Start?
Create a visual timeline to correlate issues with policy deployments:
ContainerNetworkLogs
| where TimeGenerated > ago(1h)
| where SourceNamespace == "pets" or DestinationNamespace == "pets"
| summarize
    Allowed = countif(Verdict == "FORWARDED"),
    Dropped = countif(Verdict == "DROPPED")
    by bin(TimeGenerated, 1m), TrafficDirection
| render timechart
What you'll discover:
A visual timeline showing:
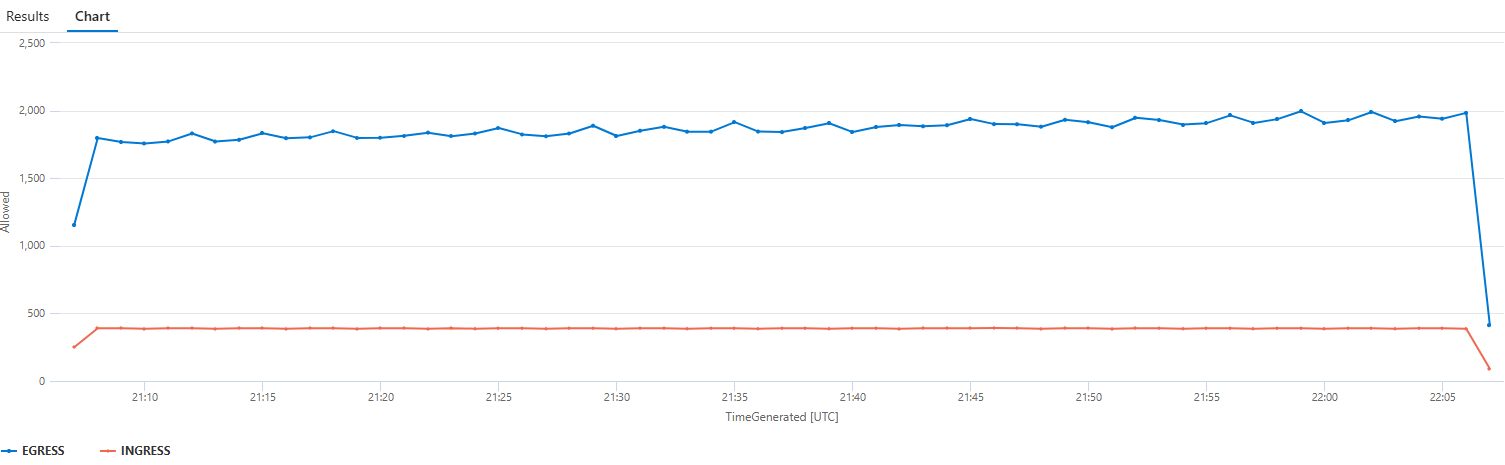
- 10:15 AM: Sudden spike in DROPPED INGRESS traffic (chaos policy applied)
- 10:15 AM: Increase in DROPPED EGRESS traffic (FQDN policy with DNS restrictions)
- Before 10:15 AM: Normal traffic patterns with minimal drops
Cumulative insights:
- ✅ Both problems started at 10:15 AM - exactly when you applied the policies
- ✅ Clear correlation between policy changes and user-reported issues
- ✅ Eliminated other causes (not an app bug, infrastructure issue, or external service outage)
Troubleshooting value: You can now confidently tell the team: "The issues started at 10:15 AM when we applied the new network policies. It's not the application code."
Next step: We've identified WHEN and WHY the problems occurred. Let's get one final summary view.
Query 6: Final Summary - Complete Diagnosis (1 minute)
Get a comprehensive view of all traffic patterns to confirm your diagnosis:
ContainerNetworkLogs
| where TimeGenerated > ago(30m)
| where SourceNamespace == "pets" or DestinationNamespace == "pets"
| summarize
    TotalFlows = count(),
    DroppedFlows = countif(Verdict == "DROPPED"),
    ForwardedFlows = countif(Verdict == "FORWARDED")
    by TrafficDirection, SourcePodName, DestinationPodName
| extend DropRate = round((DroppedFlows * 100.0) / TotalFlows, 2)
| where TotalFlows > 5  // Filter out noise
| order by DroppedFlows desc
| take 20
What you'll discover:
| TrafficDirection | SourcePodName | DestinationPodName | TotalFlows | DroppedFlows | DropRate% |
|---|---|---|---|---|---|
| INGRESS | (external) | store-front-abc123 | 156 | 156 | **100%** |
| EGRESS | store-front-abc123 | (external) | 89 | 23 | 25.8% |
| EGRESS | store-front-abc123 | kube-dns | 45 | 12 | 26.7% |
Complete Diagnosis Achieved:
Problem 1: External Users Can't Access the Application
- Evidence: INGRESS to store-front has 100% drop rate (156 flows, all dropped)
- Root Cause: Chaos policy has
ingress: - fromEndpoints: [](allow from nowhere = block all) - Fix Needed: Restore original policy with
fromEntities: - world
Problem 2: External API Calls Failing
- Evidence: EGRESS to external has 25.8% drop rate, DNS queries have 26.7% drop rate
- Root Cause: FQDN policy missing domains (api.github.com, google.com, bing.com) from DNS
matchPatternrules - Fix Needed: Add missing domains to DNS patterns OR remove from toFQDNs list
Problem 3: Internal Communication Working Fine
- Evidence: EGRESS between pods in pets namespace has greater than 5% drop rate (filtered out)
- Conclusion: Application code and internal services are healthy
Diagnosis Summary: What You Learned
By using container network flow logs with a progressive, cumulative approach, you:
- Query 1 (30s): Identified TWO distinct problems (INGRESS + EGRESS) from high-level metrics
- Query 2 (1m): Diagnosed INGRESS issue with exact source IPs and timestamps
- Query 3 (2m): Separated DNS failures from connection failures in EGRESS traffic
- Query 4 (2m): Correlated DNS + HTTPS to understand complete flow patterns
- Query 5 (1m): Visualized timeline to correlate with policy deployment
- Query 6 (1m): Confirmed complete diagnosis with drop rate percentages
Each query built on the previous one, creating a comprehensive understanding of:
- What is failing (INGRESS blocked, DNS queries dropped)
- Who is affected (external users, specific domains)
- When it started (10:15 AM policy deployment)
- Why it's happening (chaos policy, missing DNS patterns)
- How to fix it (restore policies, add DNS rules)
Choosing the Right Network Monitoring Tool:
-
Log Analytics Flow Logs: Best for historical analysis and forensic investigation. Data has incurs storage costs, but allows you to query traffic patterns from hours, days, or weeks ago to understand trends and investigate past incidents.
-
Hubble CLI/UI: Best for real-time troubleshooting and live monitoring. Provides instant visibility into current network flows without storage costs, making it ideal for active debugging and immediate issue resolution.
Key Takeaways
Flow logs accelerate troubleshooting by providing:
- Individual flow records with complete context (source, destination, verdict, reason)
- Historical queryability to investigate issues that occurred hours or days ago
- Forensic details that metrics alone cannot provide
- Correlation capabilities to connect issues with deployments and policy changes
Visualize Network Flow Logs with Grafana Dashboards
Now that you've used KQL queries to diagnose the root cause with detailed forensic analysis, let's explore how Grafana dashboards can visualize container network flow logs for easier sharing and visual investigation.
Access Flow Logs Dashboards
ACNS provides specialized dashboards for container network flow logs with forensic-level details:
- Open the Azure Portal and search for Monitor
- Select the Monitor resource
- In the left navigation pane, select Dashboards with Grafana
- Search for dashboards under Azure | Insights | Containers | Networking |
dashboard name
Explore Flow Logs Dashboards
Available Flow Logs Dashboards:
- Flow Logs (Internal Traffic): Service-to-service communication analysis
- Flow Logs (External Traffic): External API calls, FQDN filtering, ingress traffic
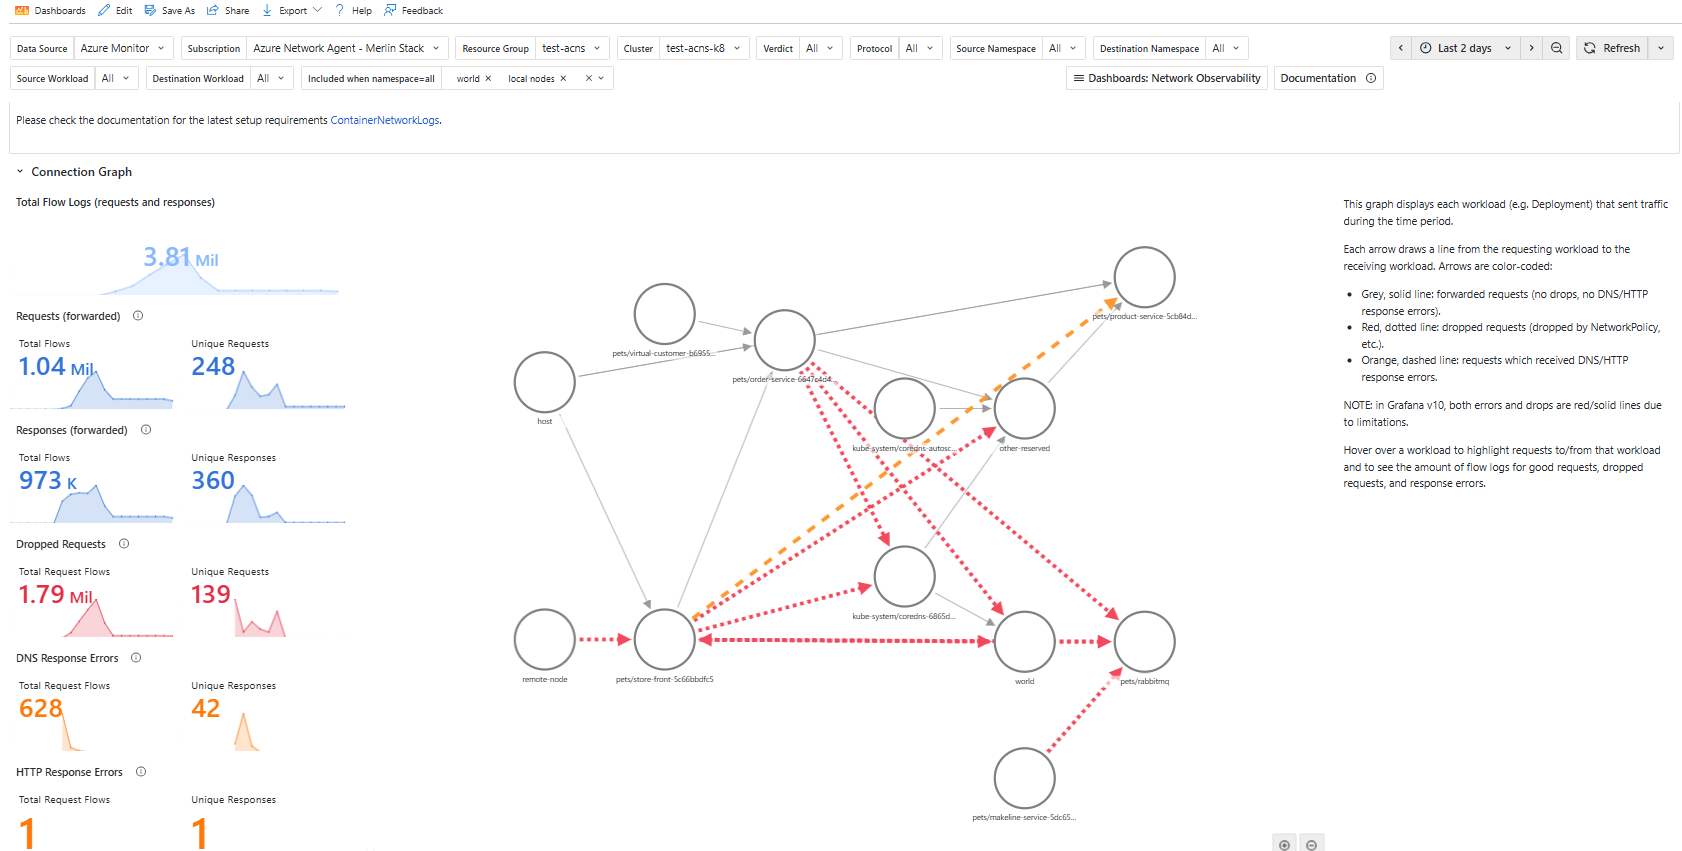
These dashboards show:
- Service dependency graphs
- Individual flow details (source/destination IPs, protocols, verdicts)
- Protocol breakdowns (DNS, HTTP, TCP/UDP)
- Filterable error logs with timestamps
Prerequisites: Flow logs dashboards require container network flow logs to be enabled and Log Analytics workspace configured with Analytics table plan. For setup instructions, see Container Network Observability Logs - Grafana Visualization.
When to Use Each Tool:
| Tool | Best For |
|---|---|
| Grafana Metrics Dashboards | Real-time monitoring, detecting anomalies, cluster health overview |
| Grafana Flow Logs Dashboards | Visual service dependencies, quick filtering, sharing insights with teams |
| Log Analytics (KQL Queries) | Complex forensic analysis, custom queries, correlating multiple data sources |
Best Practice: Use Metrics dashboards for detection, Flow Logs dashboards for visual analysis, and KQL queries for deep forensic investigation when needed.
Lets remove the aks-combined-fqdn-l7.yaml file used in the previous section by running the following command:
kubectl delete cnp combined-fqdn-l7-policy -n pets
Optimize Metrics Collection with Container Network Metrics Filtering
By this point in the lab, you've enabled full network observability — metrics dashboards and flow logs. In a production cluster with hundreds of pods and services, all of this data adds up. Every pod-to-pod flow, every DNS query, every TCP connection generates Hubble metrics that are scraped by Prometheus and stored in your monitoring backend.
This is where container network metrics filtering comes in. It gives you dynamic, source-level control over which Hubble metrics are collected — before they ever reach Prometheus. Instead of collecting everything and filtering later (expensive), you define what matters at the source (cost-effective). This is the ACNS way: smart observability, cut the noise and cut the cost.
Why metrics filtering matters for production
Consider the cost impact of unfiltered metrics in a real cluster:
| Cluster size | Pods | Estimated Hubble metric time series (unfiltered) | Monthly ingestion cost (Azure Monitor)* |
|---|---|---|---|
| Small | 50 | ~15,000 | ~$75 |
| Medium | 200 | ~120,000 | ~$600 |
| Large | 1,000 | ~1,500,000 | ~$7,500+ |
*Approximate costs based on Azure Monitor pricing for Prometheus metrics. Actual costs vary by region and data volume.
In large clusters, system namespaces like kube-system, gatekeeper-system, and monitoring namespaces can generate 60-80% of all network metrics — most of which you never look at during day-to-day operations. Filtering these out at the source can cut your metrics storage costs significantly while keeping full visibility into the namespaces and workloads that matter.
Container network metrics filtering works specifically with Cilium data planes and requires Kubernetes version 1.32 or later. Since the cluster you created earlier in this lab uses Azure CNI with Cilium, you already meet these requirements.
How metrics filtering works
Metrics filtering uses a Kubernetes Custom Resource Definition (CRD) called ContainerNetworkMetric. You define filtering rules that tell the Cilium agents which Hubble metrics to collect and which to skip. Key characteristics:
- One CRD per cluster — only a single
ContainerNetworkMetricresource can exist - Dynamic reconciliation — changes take effect in approximately 30 seconds without restarting Cilium agents or Prometheus
- No CRD = collect everything — if you don't apply a CRD, all metrics are collected (the current default behavior)
- Four metric types —
dns,flow,tcp, anddrop - Include and exclude filters — target by namespace/pod, label selector, IP/CIDR, protocol, or verdict
Register the preview feature flag
Container network metrics filtering is currently in preview. Register the feature flag if you haven't already (this was included in the prerequisites, but verify it's registered).
az feature show --namespace "Microsoft.ContainerService" --name "AdvancedNetworkingDynamicMetricsPreview" --query "properties.state" -o tsv
If the output is not Registered, wait a few minutes and check again. Once registered, refresh the provider:
az provider register --namespace Microsoft.ContainerService
Measure your baseline metrics volume
Before applying any filters, let's see how many Hubble metric time series your cluster is currently generating. This gives you a baseline to compare against after filtering.
Run the following command to check the current Hubble metrics being scraped. Port-forward the Prometheus endpoint from a Cilium agent pod:
CILIUM_POD=$(kubectl get pods -n kube-system -l k8s-app=cilium -o jsonpath='{.items[0].metadata.name}')
kubectl port-forward -n kube-system $CILIUM_POD 9965:9965 >/dev/null &
Now count the number of Hubble metric time series:
curl -s http://localhost:9965/metrics | grep -c "^hubble_"
Note this number — this is your unfiltered baseline. In a cluster with the AKS Store demo application running, you'll typically see several hundred time series.
Also check which namespaces are generating the most metrics:
curl -s http://localhost:9965/metrics | grep "^hubble_" | grep -oP 'source="[^"]*"' | sort | uniq -c | sort -rn | head -10
You'll likely see that kube-system pods dominate the metrics output. These are infrastructure metrics that, while occasionally useful, are rarely needed for application-level troubleshooting.
Stop the port-forward:
kill %1 2>/dev/null
Apply a targeted metrics filter for the pets namespace
Now let's apply a filter that focuses metrics collection on the pets namespace (where your application workloads run) and excludes noisy system namespaces. This simulates a real production configuration where you want visibility into your applications but don't want to pay for metrics you rarely use.
Create and apply the filtering CRD:
kubectl apply -f - <<'EOF'
apiVersion: acn.azure.com/v1alpha1
kind: ContainerNetworkMetric
metadata:
  name: container-network-metric
spec:
  filters:
    # Collect flow metrics only for the pets namespace
    - metric: flow
      includeFilters:
        - name: pets-app-flows
          from:
            labelSelector:
              matchExpressions:
                - key: k8s.io/namespace
                  operator: In
                  values:
                    - pets
        - name: pets-app-flows-ingress
          to:
            labelSelector:
              matchExpressions:
                - key: k8s.io/namespace
                  operator: In
                  values:
                    - pets

    # Collect DNS metrics but exclude kube-system noise
    - metric: dns
      excludeFilters:
        - name: exclude-system-dns
          from:
            namespacedPod:
              - "kube-system/"

    # Collect TCP metrics only for the pets namespace
    - metric: tcp
      includeFilters:
        - name: pets-tcp-metrics
          from:
            labelSelector:
              matchExpressions:
                - key: k8s.io/namespace
                  operator: In
                  values:
                    - pets

    # Collect all drop metrics (always useful for troubleshooting)
    - metric: drop
      excludeFilters:
        - name: exclude-system-drops
          from:
            namespacedPod:
              - "kube-system/"
EOF
Verify the CRD was applied:
kubectl get ContainerNetworkMetric
You should see your container-network-metric resource listed. Wait approximately 30 seconds for the filtering rules to reconcile across the Cilium agents.
Understand what this filter does
The filter you just applied makes four targeted decisions:
| Metric type | Filter strategy | What it collects | What it skips |
|---|---|---|---|
flow | Include only pets namespace | Pod-to-pod flows for store-front, order-service, product-service, etc. | All kube-system, monitoring, and other namespace flows |
dns | Exclude kube-system | DNS queries from pets and other app namespaces | CoreDNS internal metrics, system DNS chatter |
tcp | Include only pets namespace | TCP connection states for your application | System-level TCP connections |
drop | Exclude kube-system | Dropped packets in application namespaces (useful for policy debugging) | Expected system-level drops |
This is a balanced production configuration — you keep full visibility into your application workloads and retain all dropped packet data (critical for troubleshooting), while cutting out the system namespace noise that inflates your metrics bill.
Verify the filtering is working
Generate some traffic so new metrics are produced under the filter:
# Generate traffic from store-front to internal services
kubectl exec -n pets -it $(kubectl get po -n pets -l app=store-front -ojsonpath='{.items[0].metadata.name}') -- sh -c 'wget --spider --timeout=2 http://product-service:3002/' 2>/dev/null

kubectl exec -n pets -it $(kubectl get po -n pets -l app=order-service -ojsonpath='{.items[0].metadata.name}') -c order-service -- sh -c 'nc -zv -w2 rabbitmq 5672' 2>/dev/null
Now check the metrics again:
CILIUM_POD=$(kubectl get pods -n kube-system -l k8s-app=cilium -o jsonpath='{.items[0].metadata.name}')
kubectl port-forward -n kube-system $CILIUM_POD 9965:9965 >/dev/null &
sleep 3

echo "--- Hubble metric time series count (filtered) ---"
curl -s http://localhost:9965/metrics | grep -c "^hubble_"

echo ""
echo "--- Top sources in filtered metrics ---"
curl -s http://localhost:9965/metrics | grep "^hubble_" | grep -oP 'source="[^"]*"' | sort | uniq -c | sort -rn | head -10

kill %1 2>/dev/null
Compare the filtered count with your baseline. You should see a meaningful reduction in the number of Hubble metric time series, with the remaining metrics focused on the pets namespace.
Preexisting metrics persist in Prometheus. The filtering rules apply only to newly generated metrics. You may need to wait for Prometheus to scrape a few cycles before the full reduction is visible. In a production environment, the cost savings compound over time as old unfiltered data ages out of your retention window.
Experiment with different filter strategies
To help you understand the flexibility of the CRD, here are two alternative configurations you can try.
Strategy A: Monitor only dropped packets (minimum cost)
If your primary concern is detecting network policy violations and you trust your application communication patterns:
kubectl apply -f - <<'EOF'
apiVersion: acn.azure.com/v1alpha1
kind: ContainerNetworkMetric
metadata:
  name: container-network-metric
spec:
  filters:
    - metric: drop
      includeFilters:
        - name: all-drops
          verdict:
            - dropped
EOF
This is the most aggressive cost reduction — you only collect metrics for dropped packets, which are the most actionable for troubleshooting.
Strategy B: Production vs. non-production filtering
In clusters that run both production and staging workloads, filter by environment labels:
kubectl apply -f - <<'EOF'
apiVersion: acn.azure.com/v1alpha1
kind: ContainerNetworkMetric
metadata:
  name: container-network-metric
spec:
  filters:
    - metric: flow
      includeFilters:
        - name: production-only
          from:
            labelSelector:
              matchLabels:
                environment: production
    - metric: dns
      includeFilters:
        - name: production-dns
          from:
            labelSelector:
              matchLabels:
                environment: production
    - metric: tcp
      includeFilters:
        - name: production-tcp
          from:
            labelSelector:
              matchLabels:
                environment: production
    - metric: drop
      includeFilters:
        - name: all-env-drops
          verdict:
            - dropped
EOF
This collects full metrics for production workloads while skipping staging and development traffic entirely.
Restore the original filter
After experimenting, restore the balanced filter from earlier:
kubectl apply -f - <<'EOF'
apiVersion: acn.azure.com/v1alpha1
kind: ContainerNetworkMetric
metadata:
  name: container-network-metric
spec:
  filters:
    - metric: flow
      includeFilters:
        - name: pets-app-flows
          from:
            labelSelector:
              matchExpressions:
                - key: k8s.io/namespace
                  operator: In
                  values:
                    - pets
        - name: pets-app-flows-ingress
          to:
            labelSelector:
              matchExpressions:
                - key: k8s.io/namespace
                  operator: In
                  values:
                    - pets
    - metric: dns
      excludeFilters:
        - name: exclude-system-dns
          from:
            namespacedPod:
              - "kube-system/"
    - metric: tcp
      includeFilters:
        - name: pets-tcp-metrics
          from:
            labelSelector:
              matchExpressions:
                - key: k8s.io/namespace
                  operator: In
                  values:
                    - pets
    - metric: drop
      excludeFilters:
        - name: exclude-system-drops
          from:
            namespacedPod:
              - "kube-system/"
EOF
Clean up the filter (optional)
To remove the filter and go back to collecting all metrics:
kubectl delete ContainerNetworkMetric container-network-metric
- Start with exclude filters — remove known noisy namespaces (
kube-system,gatekeeper-system, monitoring namespaces) before adding include filters for specific workloads. - Always keep drop metrics — dropped packet metrics are cheap to store and critical for troubleshooting network policy issues. Never filter these out completely.
- Test in staging first — validate that your filter doesn't hide metrics you need before applying to production.
- Review periodically — as your cluster evolves and new workloads are deployed, review your filter to ensure important data isn't being excluded.
- One CRD per cluster — remember that only one
ContainerNetworkMetricresource can exist. Plan your filter to cover all your needs in a single CRD.
Optional: Real-Time Network Flow Observation with Hubble
The following sections cover Hubble CLI and Hubble UI, which provide real-time network flow observation capabilities. These tools are optional — Container Network Flow Logs and Container Network Metrics Filtering (covered earlier in this lab) are the core ACNS offerings for production observability.
Hubble CLI and UI are useful for:
- Live troubleshooting when you need instant feedback without waiting for Log Analytics ingestion
- Real-time verification of network policy changes
- Visual service dependency mapping for understanding traffic patterns
However, for most production use cases, the combination of Container Network Flow Logs (for forensic analysis) and metrics filtering (for cost-optimized observability) provides comprehensive coverage.
Observe On-Demand Network Flows with Hubble CLI
For instant, on-demand network flow observation without waiting for Log Analytics ingestion, use Hubble CLI. This is ideal for live troubleshooting and immediate verification of network policies.
Install Hubble CLI:
# Install Hubble CLI
if [ "$(uname -m)" = "aarch64" ]; then HUBBLE_ARCH="arm64"; fi
curl -L --fail --remote-name-all https://github.com/cilium/hubble/releases/download/${HUBBLE_VERSION}/hubble-${HUBBLE_OS}-${HUBBLE_ARCH}.tar.gz{,.sha256sum}
sha256sum --check hubble-${HUBBLE_OS}-${HUBBLE_ARCH}.tar.gz.sha256sum
sudo tar xzvfC hubble-${HUBBLE_OS}-${HUBBLE_ARCH}.tar.gz /usr/local/bin
rm hubble-${HUBBLE_OS}-${HUBBLE_ARCH}.tar.gz{,.sha256sum}
Port forward Hubble Relay:
kubectl port-forward -n kube-system svc/hubble-relay --address 127.0.0.1 4245:443
Move the port forward to the background by pressing Ctrl + z and then type bg.
Configure the client with Hubble certificate:
#!/usr/bin/env bash

set -euo pipefail
set -x

# Directory where certificates will be stored
CERT_DIR="$(pwd)/.certs"
mkdir -p "$CERT_DIR"

declare -A CERT_FILES=(
  ["tls.crt"]="tls-client-cert-file"
  ["tls.key"]="tls-client-key-file"
  ["ca.crt"]="tls-ca-cert-files"
)

for FILE in "${!CERT_FILES[@]}"; do
  KEY="${CERT_FILES[$FILE]}"
  JSONPATH="{.data['${FILE//./\\.}']}"

  # Retrieve the secret and decode it
  kubectl get secret hubble-relay-client-certs -n kube-system -o jsonpath="${JSONPATH}" | base64 -d > "$CERT_DIR/$FILE"

  # Set the appropriate hubble CLI config
  hubble config set "$KEY" "$CERT_DIR/$FILE"
done

hubble config set tls true
hubble config set tls-server-name instance.hubble-relay.cilium.io
Check Hubble pods are running using the kubectl get pods command.
kubectl get pods -o wide -n kube-system -l k8s-app=hubble-relay
Your output should look similar to the following example output:
NAME                            READY   STATUS    RESTARTS   AGE    IP            NODE                                 NOMINATED NODE   READINESS GATES
hubble-relay-7ff97868ff-tvwcf   1/1     Running   0          101m   10.244.2.57   aks-systempool-10200747-vmss000000   none           none
Using Hubble we will look for what is dropped.
hubble observe --verdict DROPPED
Here we can see traffic coming from world dropped in store-front:
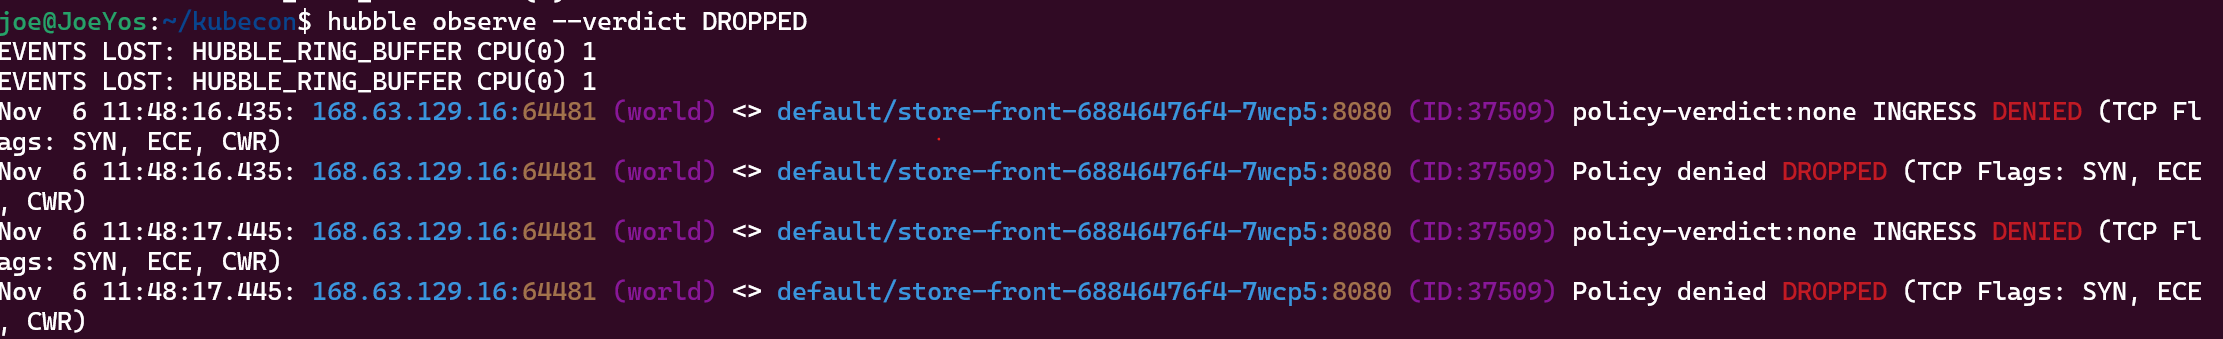
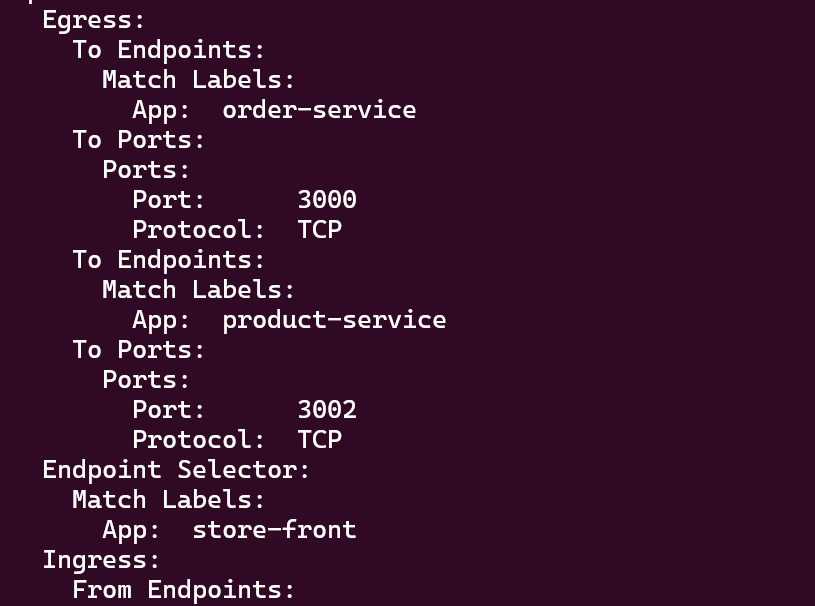
So now we can tell that there is a problem with the frontend ingress traffic configuration, let's review the allow-store-front-traffic policy:
kubectl describe -n pets cnp allow-store-front-traffic
Here we go, we see that the Ingress traffic is not allowed:
Now to solve the problem we will apply the original policy.
Run the following command to apply the original network policy from the assets folder.
curl -o acns-network-policy-allow-store-front-traffic.yaml https://raw.githubusercontent.com/Azure-Samples/aks-labs/refs/heads/main/docs/networking/assets/acns-network-policy-allow-store-front-traffic.yaml
Optionally, view the contents of the network policy manifest file.
cat acns-network-policy-allow-store-front-traffic.yaml
Apply the network policy to the pets namespace.
kubectl apply -n pets -f acns-network-policy-allow-store-front-traffic.yaml
You should now see the traffic flowing again and you are able to access the pets shop app UI.
Visualize Traffic with Hubble UI
Install Hubble UI
Run the following command to apply the Hubble UI manifest file from the assets folder.
curl -o acns-hubble-ui.yaml https://raw.githubusercontent.com/Azure-Samples/aks-labs/refs/heads/main/docs/networking/assets/acns-hubble-ui.yaml
Optionally, run the following command to take a look at the Hubble UI manifest file.
cat acns-hubble-ui.yaml
Apply the hubble-ui.yaml manifest to your cluster, using the following command:
kubectl apply -f acns-hubble-ui.yaml
Forward Hubble Relay Traffic
Set up port forwarding for Hubble UI using the kubectl port-forward command.
kubectl -n kube-system port-forward svc/hubble-ui 12000:80
Access Hubble UI
Access Hubble UI by entering http://localhost:12000/ into your web browser.
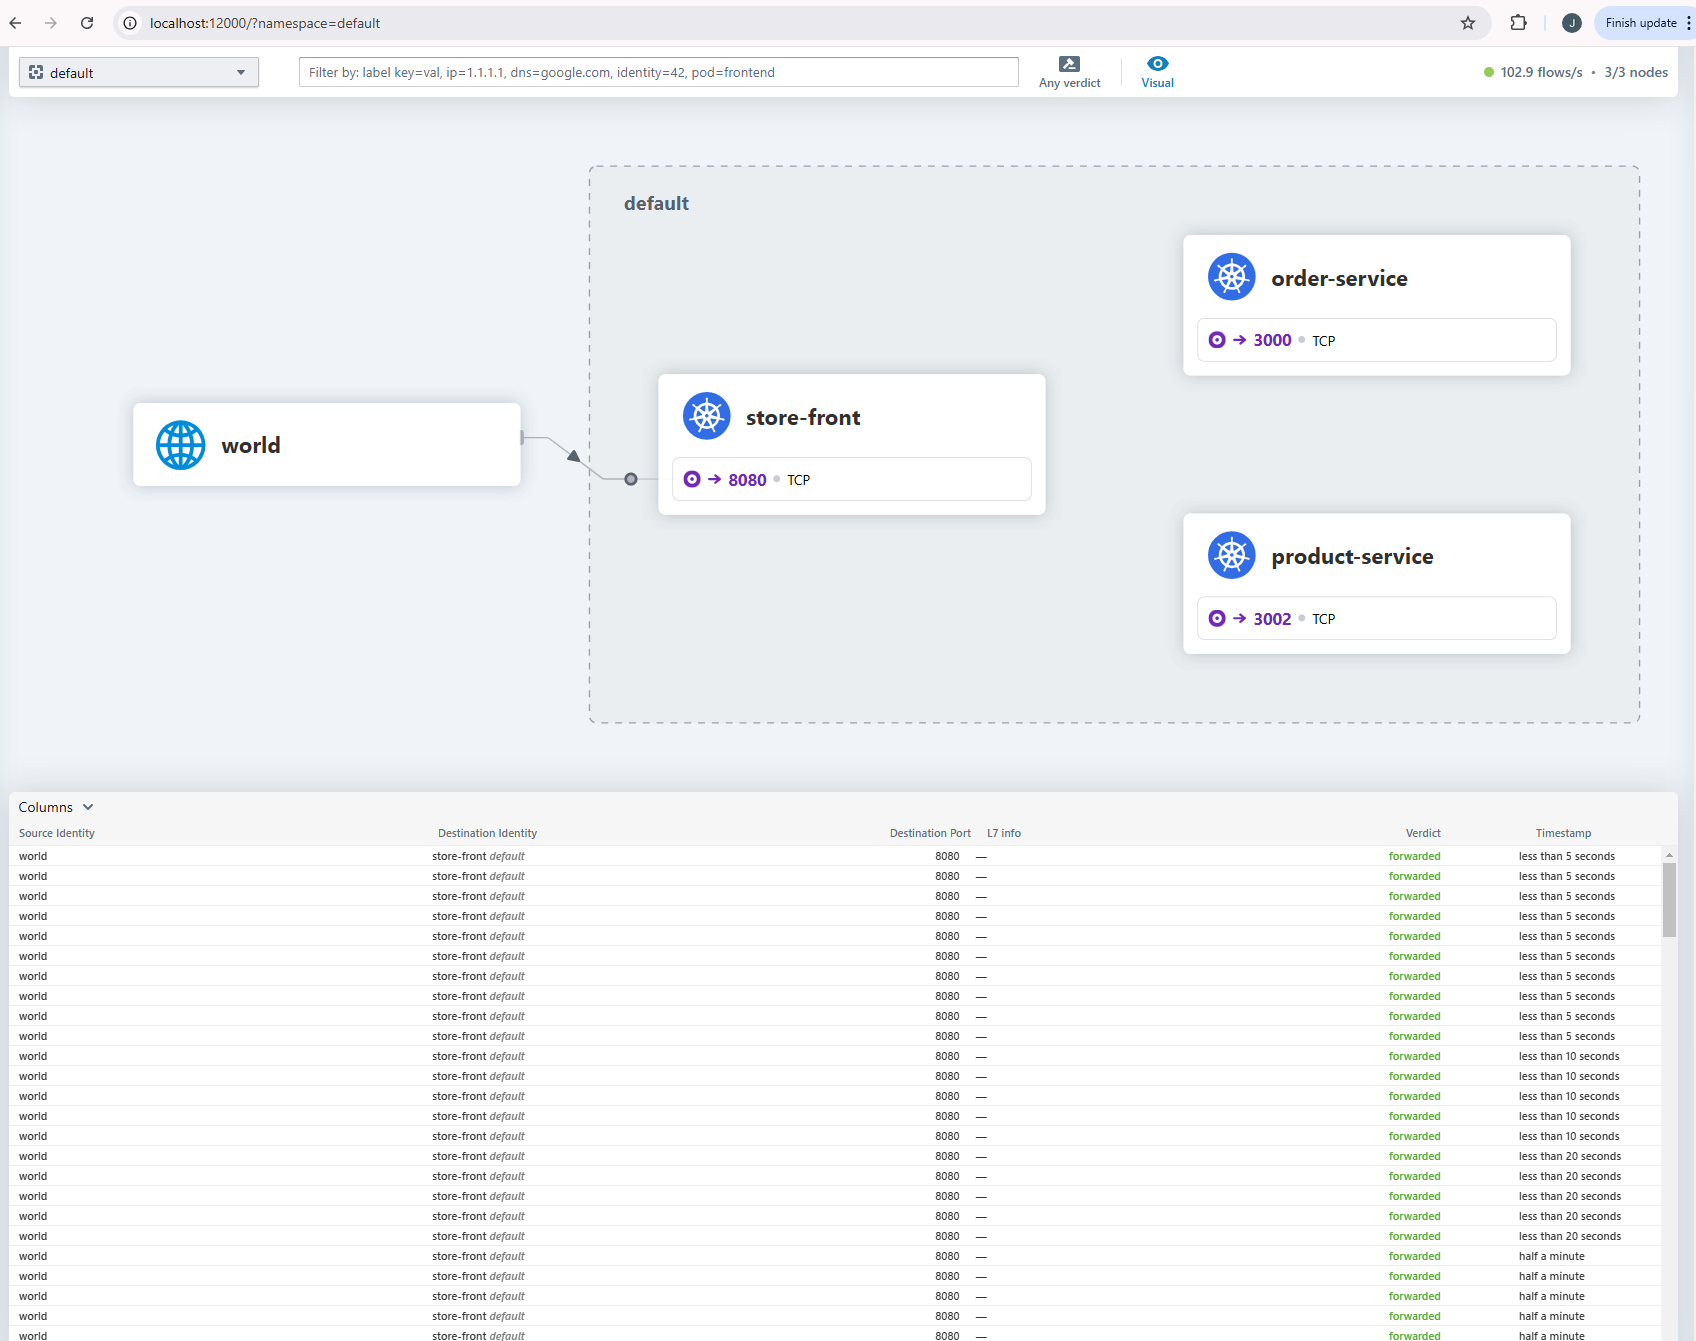
-
Container Network Flow Logs (Log Analytics): Best for forensic analysis, compliance, and historical investigation. All network flows are stored and queryable for your retention period. This is the primary ACNS observability offering.
-
Container Network Metrics Filtering: Best for cost optimization. Focus Prometheus metrics collection on the workloads that matter, cutting noise and cost. This is the primary ACNS cost optimization offering.
-
Hubble CLI (Optional): Best for live troubleshooting when you need instant feedback. No storage costs, but no historical data.
-
Hubble UI (Optional): Best for visual exploration and sharing service dependency maps with teams.
For production clusters, the combination of Container Network Flow Logs and metrics filtering provides smart observability at low cost.
Summary
Congratulations on completing this lab!
You now have hands-on experience with Advanced Container Networking Services (ACNS) — delivering smart observability at low cost by focusing on the data that matters while cutting the noise.
In this lab, you:
-
Deployed an AKS cluster with ACNS enabled using Azure CNI Powered by Cilium.
-
Implemented Layer 3/4 Network Policies to control traffic between pods and namespaces.
-
Applied FQDN filtering policies to restrict external domain access with DNS pattern matching.
-
Detected network anomalies using Azure Managed Grafana dashboards for real-time metrics monitoring.
-
Configured Container Network Flow Logs and used Log Analytics KQL queries for forensic troubleshooting — the core ACNS observability offering.
-
Enforced Layer 7 HTTP policies for application-layer traffic control and validated them through flow log analysis.
-
Visualized flow logs with Grafana dashboards for team-friendly visual analysis.
-
Configured container network metrics filtering to reduce metrics volume, cut storage costs, and focus observability on the workloads that matter — the core ACNS cost optimization offering.
-
(Optional) Explored Hubble CLI and UI for real-time network flow observation.
Key Takeaway: ACNS provides high observability at low cost through targeted data collection (flow logs) and smart metrics filtering — allowing you to cut the noise and cut the cost while maintaining full visibility into your Kubernetes network traffic.
Next Steps
If you want to dive deeper, check out:
For more hands-on workshops, explore:
Cleanup (Optional)
If you no longer need the resources from this lab, you can delete your AKS cluster:
az aks delete \
  --resource-group ${RG_NAME} \
  --name ${AKS_NAME} \
  --no-wait