Kubernetes the Easy Way with AKS Automatic
This workshop shows you how easy it is to deploy applications to AKS Automatic. AKS Automatic is a fully managed Kubernetes service that simplifies the deployment, management, and operations of Kubernetes clusters. Deploy a cluster with just a few steps in the Azure portal and focus on building your applications!
Objectives
After completing this workshop, you will be able to:
- Deploy an application to an AKS Automatic cluster
- Troubleshoot application issues
- Integrate applications with Azure services
- Scale your cluster and applications
- Observe your cluster and applications
Architecture
The following diagram shows the components you'll work with in this workshop and how they connect.
Prerequisites
Before you begin, you will need an Azure subscription with Owner permissions and a GitHub account.
In addition, you will need the following tools installed on your local machine:
- Visual Studio Code with the following extensions:
- Azure CLI
- GitHub CLI
- Git
- kubectl
- hey - HTTP load generator for testing application scaling
- POSIX-compliant shell (bash, zsh, Azure Cloud Shell)
Setup Azure CLI
Start by logging into Azure by run the following command and follow the prompts:
az login --use-device-code
You can log into a different tenant by passing in the --tenant flag to specify your tenant domain or tenant ID.
Run the following command to register preview features.
az extension add --name aks-preview
This workshop will need some Azure preview features enabled and resources to be pre-provisioned. You can use the Azure CLI commands below to register the preview features.
Register preview features.
az feature register --namespace Microsoft.ContainerService --name AzureMonitorAppMonitoringPreview
Register resource providers.
az provider register --namespace Microsoft.DevHub
az provider register --namespace Microsoft.Insights
az provider register --namespace Microsoft.PolicyInsights
az provider register --namespace Microsoft.ServiceLinker
As noted in the AKS Automatic documentation, AKS Automatic tries to dynamically select a virtual machine size for the system node pool based on the capacity available in the subscription. Make sure your subscription has quota for 16 vCPUs of any of the following sizes in the region you're deploying the cluster to: Standard_D4pds_v5, Standard_D4lds_v5, Standard_D4ads_v5, Standard_D4ds_v5, Standard_D4d_v5, Standard_D4d_v4, Standard_DS3_v2, Standard_DS12_v2. You can view quotas for specific VM-families and submit quota increase requests through the Azure portal.
Also, to support the deployment of AKS Automatic in private virtual networks, AKS Automatic is currently limited to regions that support API Server VNet integration. See the limited availability section of the Use API Server VNet integration for more details.
Setup Resource Group
In this workshop, we will set environment variables for the resource group name and location.
The following commands will set the environment variables for your current terminal session. If you close the current terminal session, you will need to set the environment variables again.
To keep the resource names unique, we will use a random number as a suffix for the resource names. This will also help you to avoid naming conflicts with other resources in your Azure subscription.
Run the following command to generate a random number.
RAND=$RANDOM
export RAND
echo "Random resource identifier will be: ${RAND}"
Set the location to a region of your choice. For example, eastus or westeurope but you should make sure this region supports availability zones.
export LOCATION=eastus
Create a resource group name using the random number.
export RG_NAME=myresourcegroup$RAND
You can list the regions that support availability zones with the following command:
az account list-locations \
--query "[?metadata.regionType=='Physical' && metadata.supportsAvailabilityZones==true].{Region:name}" \
--output table
Run the following command to create a resource group using the environment variables you just created.
az group create \
--name ${RG_NAME} \
--location ${LOCATION}
Set up resources
To keep focus on AKS-specific features, this workshop requires several Azure resources to be pre-provisioned, including:
- Azure Log Analytics Workspace for container insights and application insights
- Azure Monitor Workspace for Prometheus metrics
- Azure Container Registry for storing container images
- Azure Key Vault for secrets management
- Azure User-Assigned Managed Identity for accessing Azure services via Workload Identity
- Azure Application Insights for application monitoring
- Azure OpenAI Service with a GPT model deployment for the AI chat feature
You can deploy these resources using a single ARM template.
Run the following command to save your user object ID to a variable.
export USER_ID=$(az ad signed-in-user show --query id -o tsv)
Run the following command to deploy the ARM template into the resource group.
az deployment group create \
--resource-group ${RG_NAME} \
--name ${RG_NAME}-deployment \
--template-uri https://raw.githubusercontent.com/azure-samples/aks-labs/refs/heads/main/docs/getting-started/aks-automatic/assets/main.json \
--parameters userObjectId=${USER_ID}
Wait until the resources are deployed. This can take around 15 minutes. Once the deployment is complete, you can navigate to the resource group in the Azure portal to view the deployed resources.
Keep your terminal open as you will need it to run commands throughout the workshop.
Deploy your app to AKS Automatic
With AKS, Automated Deployments lets you create GitHub Actions workflows to deploy your applications to your AKS cluster with minimal effort, even if you don't already have one. All you need to do is point it at a GitHub repository with your application code.
If you have Dockerfiles or Kubernetes manifests in your repository, that's great, you can simply point to them in the Automated Deployments setup. If you don't have Dockerfiles or Kubernetes manifests in your repository, don't worry! Automated Deployments can create them for you.
Fork and clone the sample repository
Open a bash shell and run the following command then follow the instructions printed in the terminal to complete the login process.
gh auth login
After you've completed the login process, run the following command to fork the contoso-air repository to your GitHub account.
gh repo fork Azure-Samples/contoso-air --clone --default-branch-only
Change into the contoso-air directory.
cd contoso-air
Set the default repository to your forked repository.
gh repo set-default
When prompted, select your fork of the repository and select Enter. Do not select the original Azure-Samples/contoso-air repository.
You're now ready to deploy the sample application to your AKS cluster.
Automated Deployments setup
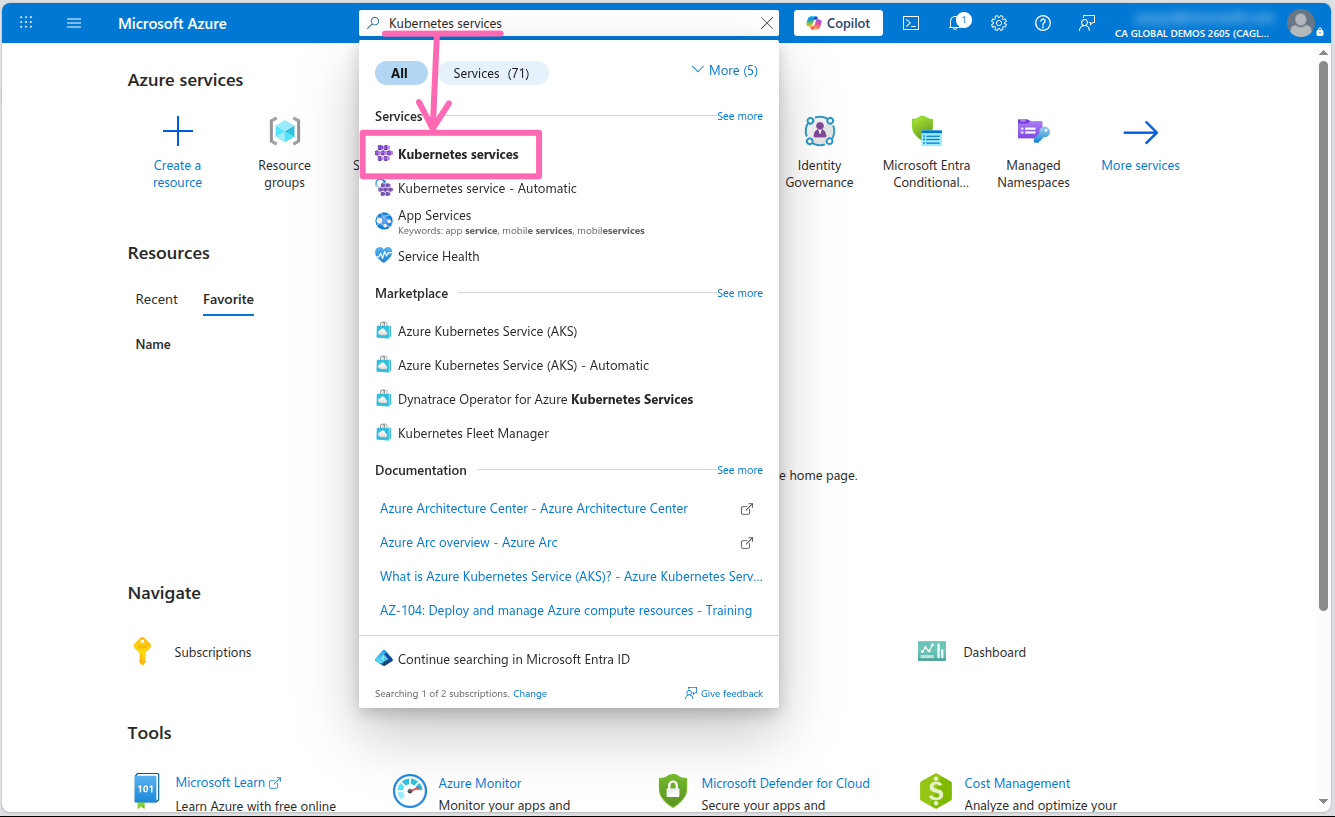
Sign in to the Azure portal, type Kubernetes services in the search box at the top of the page, and select the Kubernetes services option from the search results.
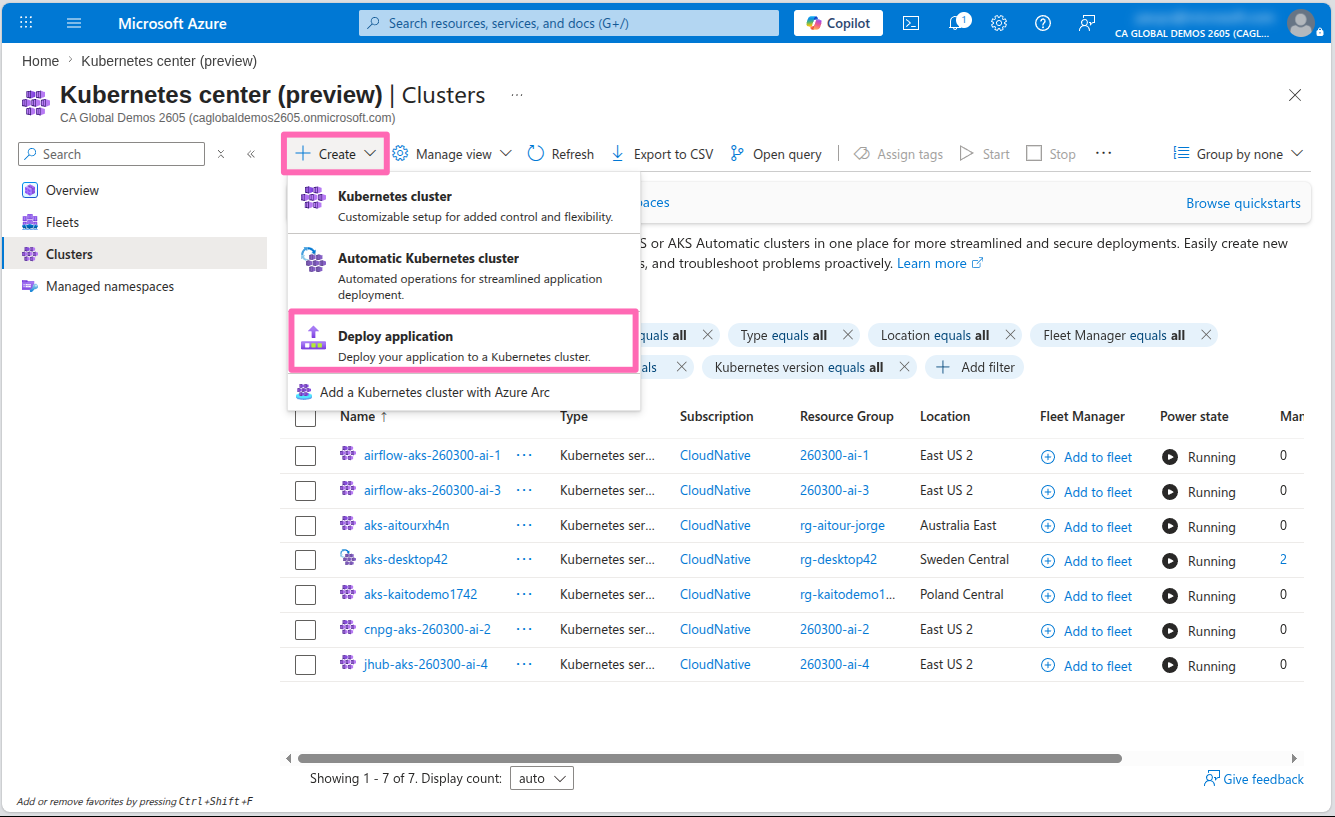
In the upper left portion of the screen, select the + Create button to view all the available options for creating a new AKS cluster.
Select the Deploy application option.
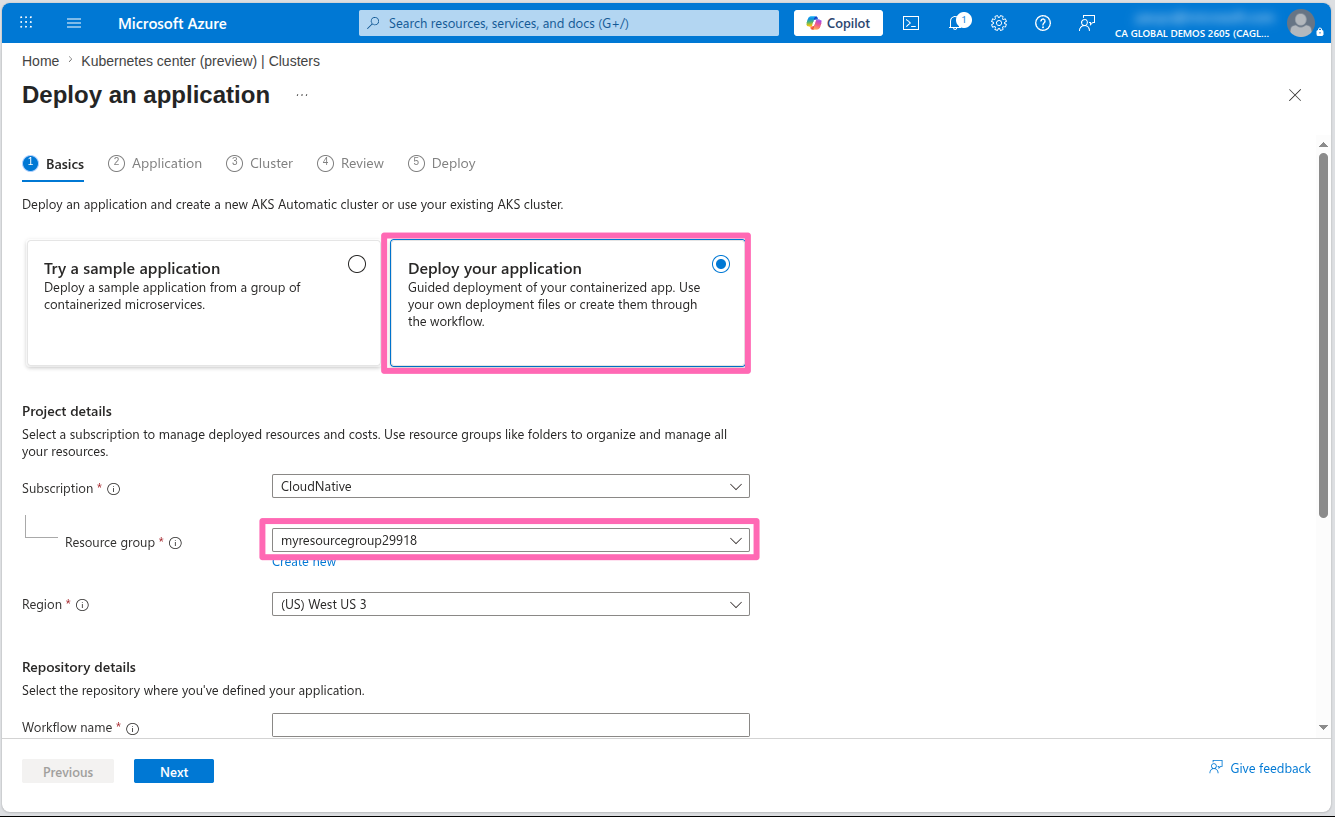
In the Basics tab, select the Deploy your application option, then select your Azure subscription and the resource group you created during the lab environment setup.
In the Repository details section set Workflow name to contoso-air.
If you have not already authorized Azure to access your GitHub account, you will be prompted to do so. Select the Authorize access button to continue. Once your GitHub account is authorized, you will be able to select the repository you forked earlier.
Select the Select repository drop-down, then select the contoso-air repository you forked earlier, and select the main branch.
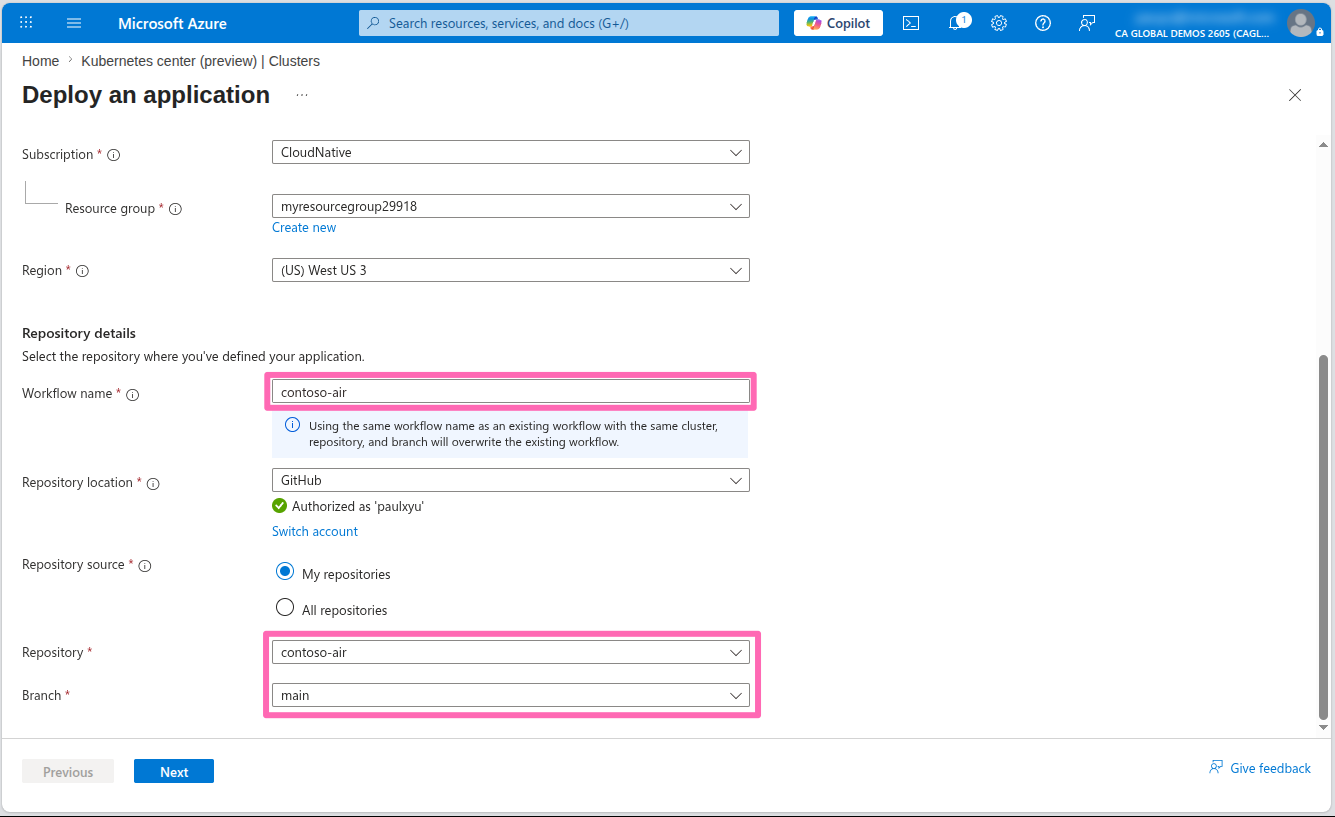
Select Next.
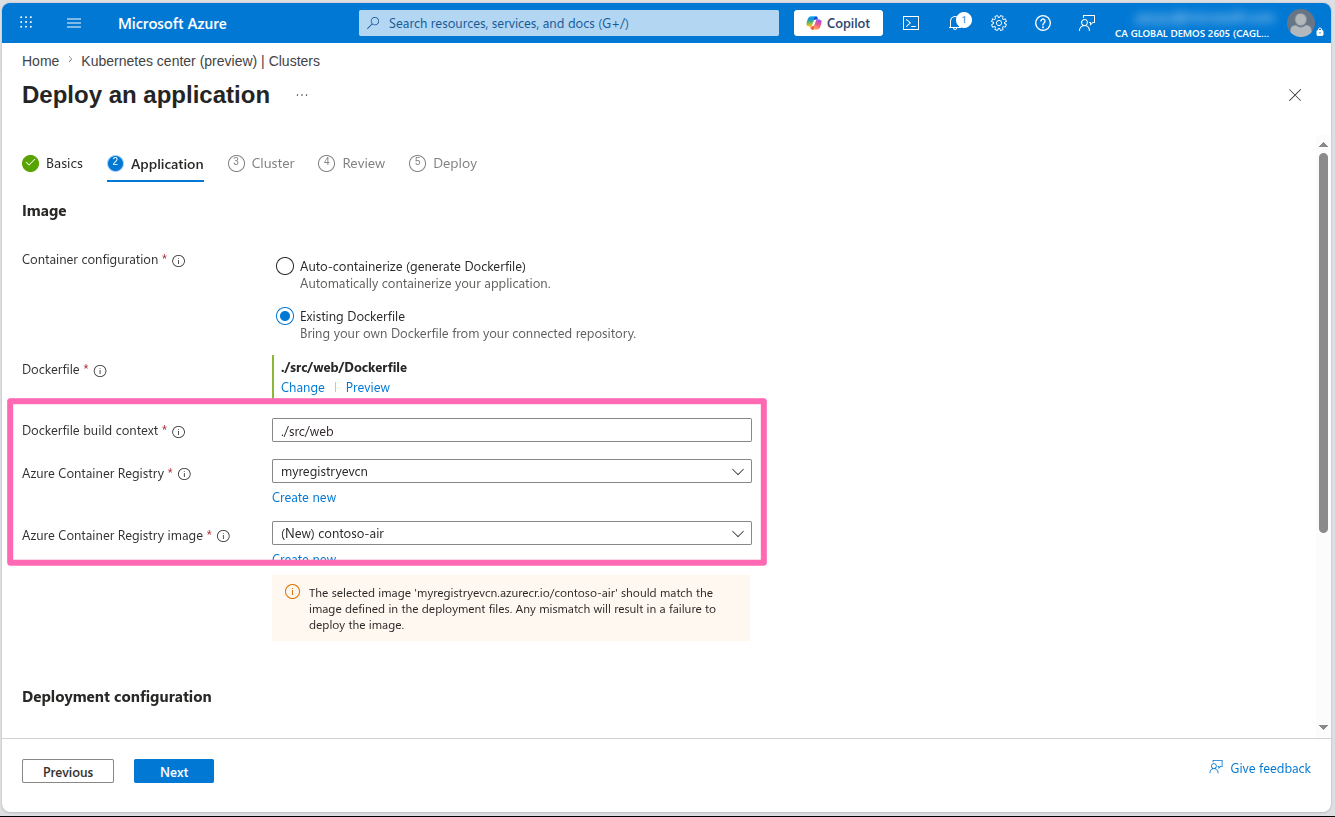
In the Application tab, complete the Image section with the following details:
- Container configuration: Select Existing Dockerfile
- Dockerfile: Select the Select link, browse to the ./src/web directory, select the Dockerfile, then select the Select button
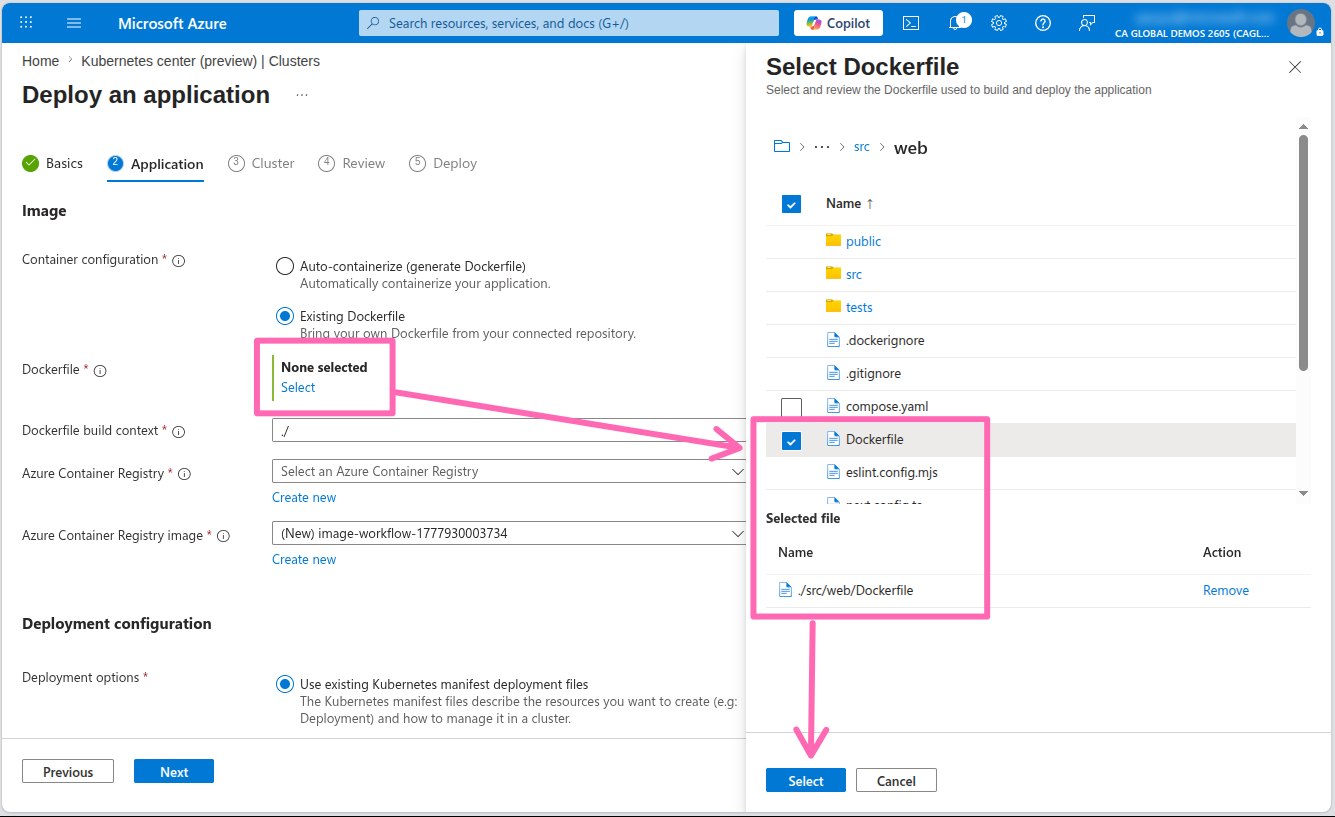
- Dockerfile build context: Enter
./src/web - Azure Container Registry: Select the Azure Container Registry in your resource group
- Azure Container Registry image: Select the Create new link then enter
contoso-air
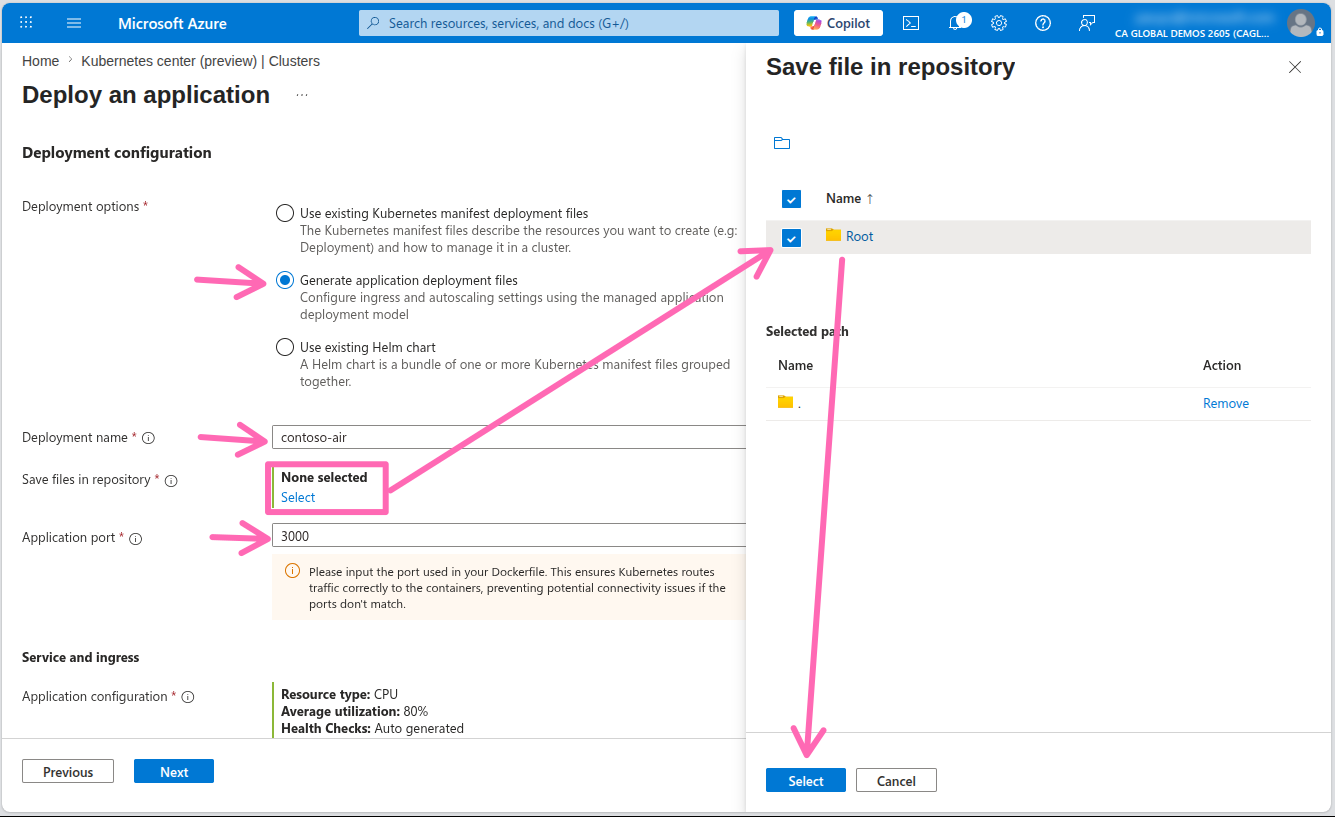
In the Deployment configuration section, fill in the following details:
- Deployment options: Select Generate application deployment files
- Save files in repository: Select the Select link to open the directory explorer, then select the checkbox next to the Root folder, then select Select.
- Application port: Enter
3000
Select Next.
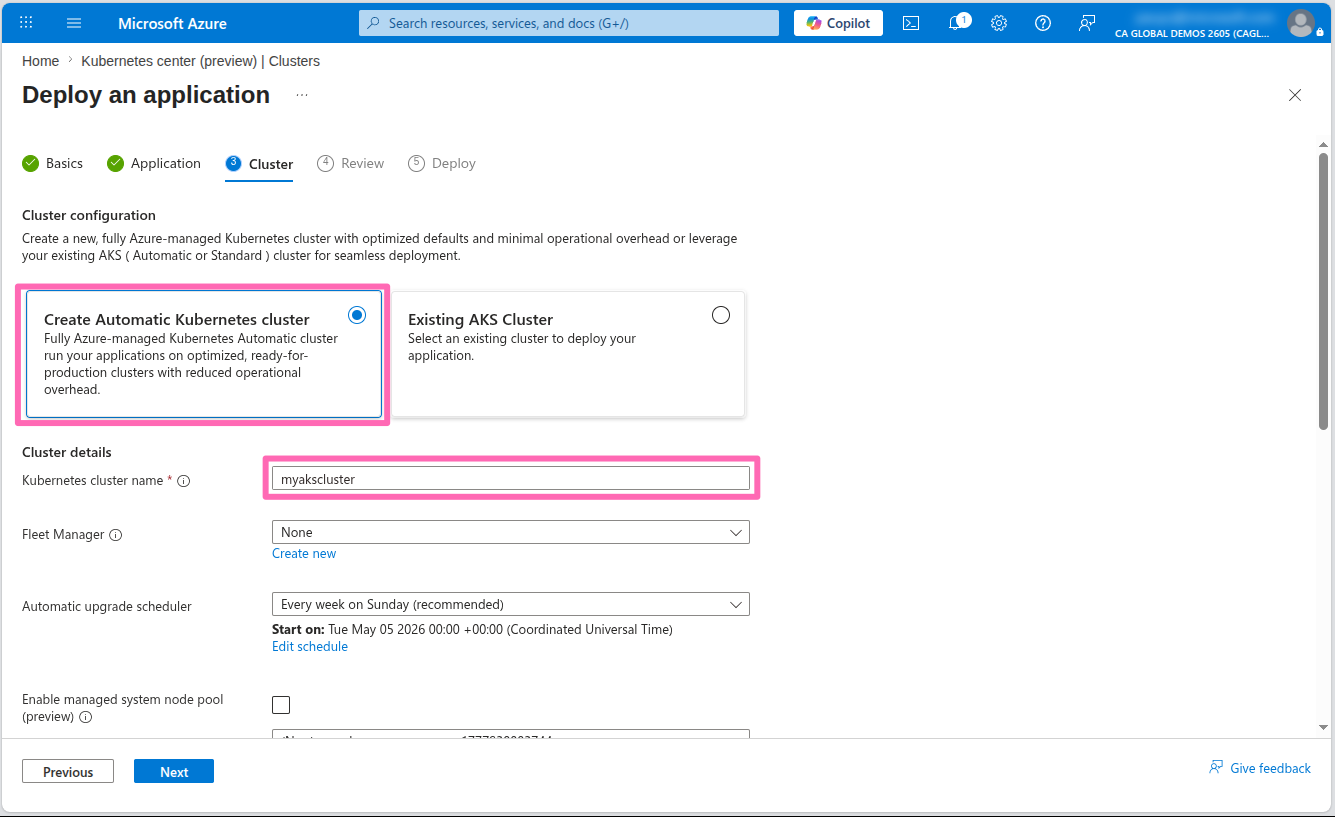
In the Cluster configuration section, ensure the Create Automatic Kubernetes cluster option is chosen and specify myakscluster as the Kubernetes cluster name.
For Namespace, select Create new and type dev.
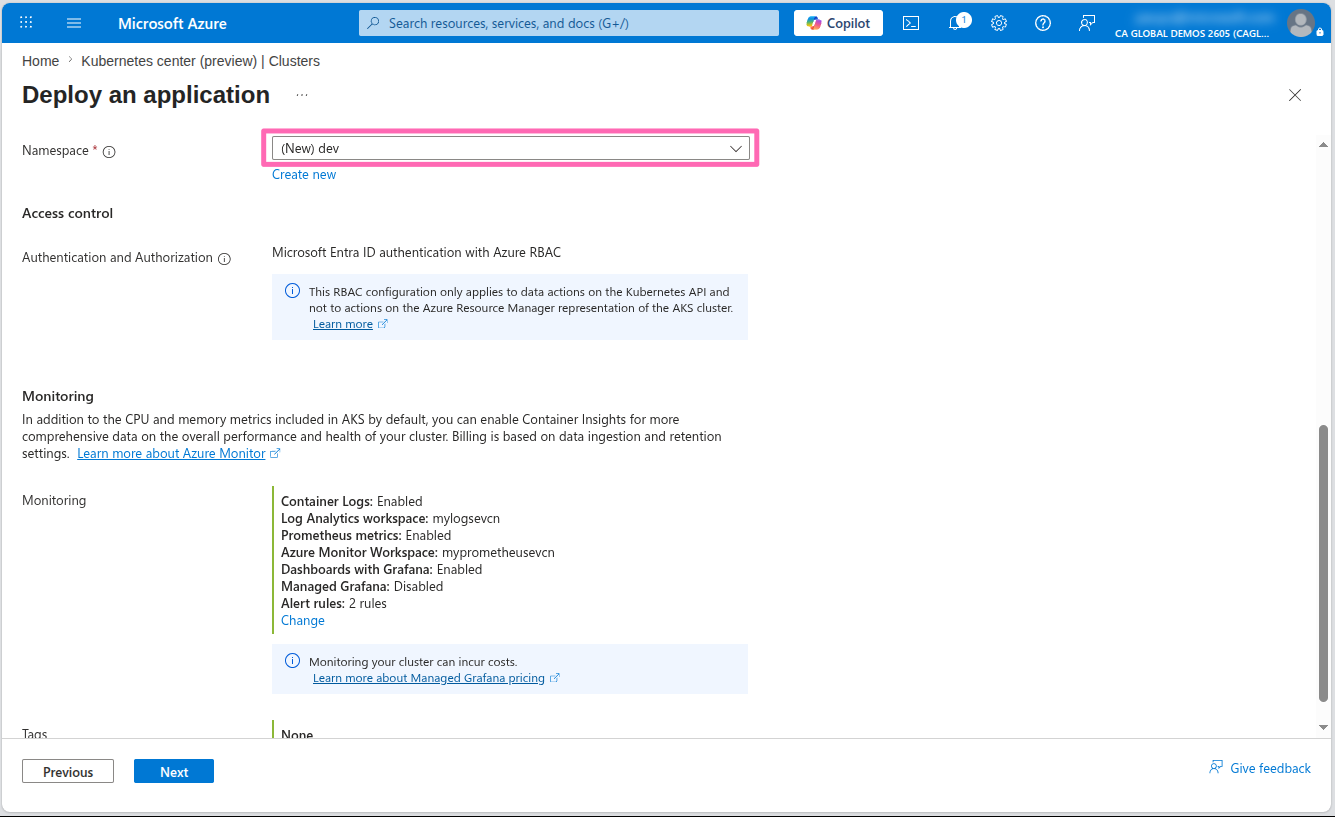
Be sure to set the namespace to dev as instructions later in the workshop will use this namespace.
You will see that the monitoring and logging options have been enabled by default and set to use the Azure resources that are available in your subscription. If you don't have these resources available, AKS Automatic will create them for you. If you want to change the monitoring and logging settings, you can do so by selecting the Change link and selecting the desired target resources for monitoring and logging. Leave the remaining fields at their default values.
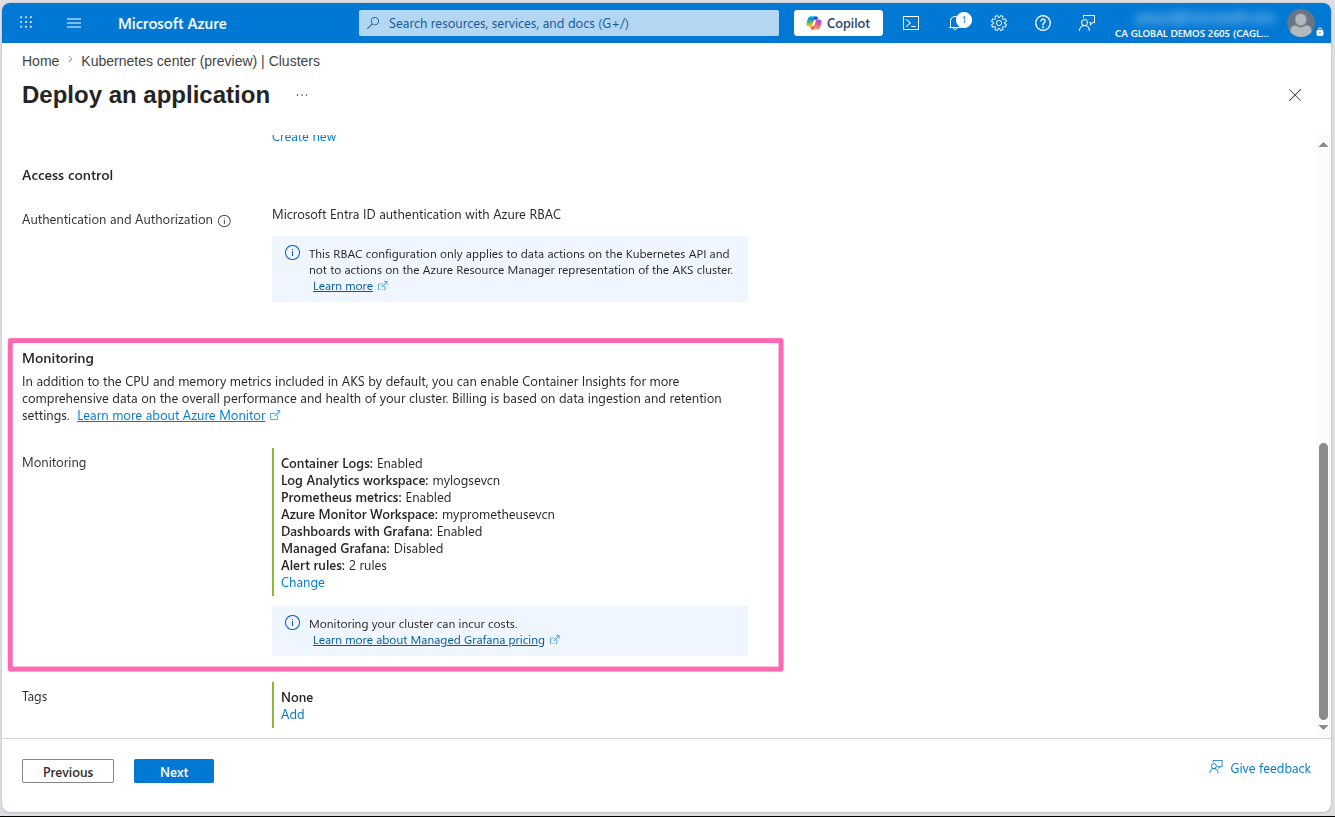
Select Next.
In the Review tab, you will see a summary of the configuration you have selected and view a preview of the Dockerfile and Kubernetes deployment files that will be generated for you.
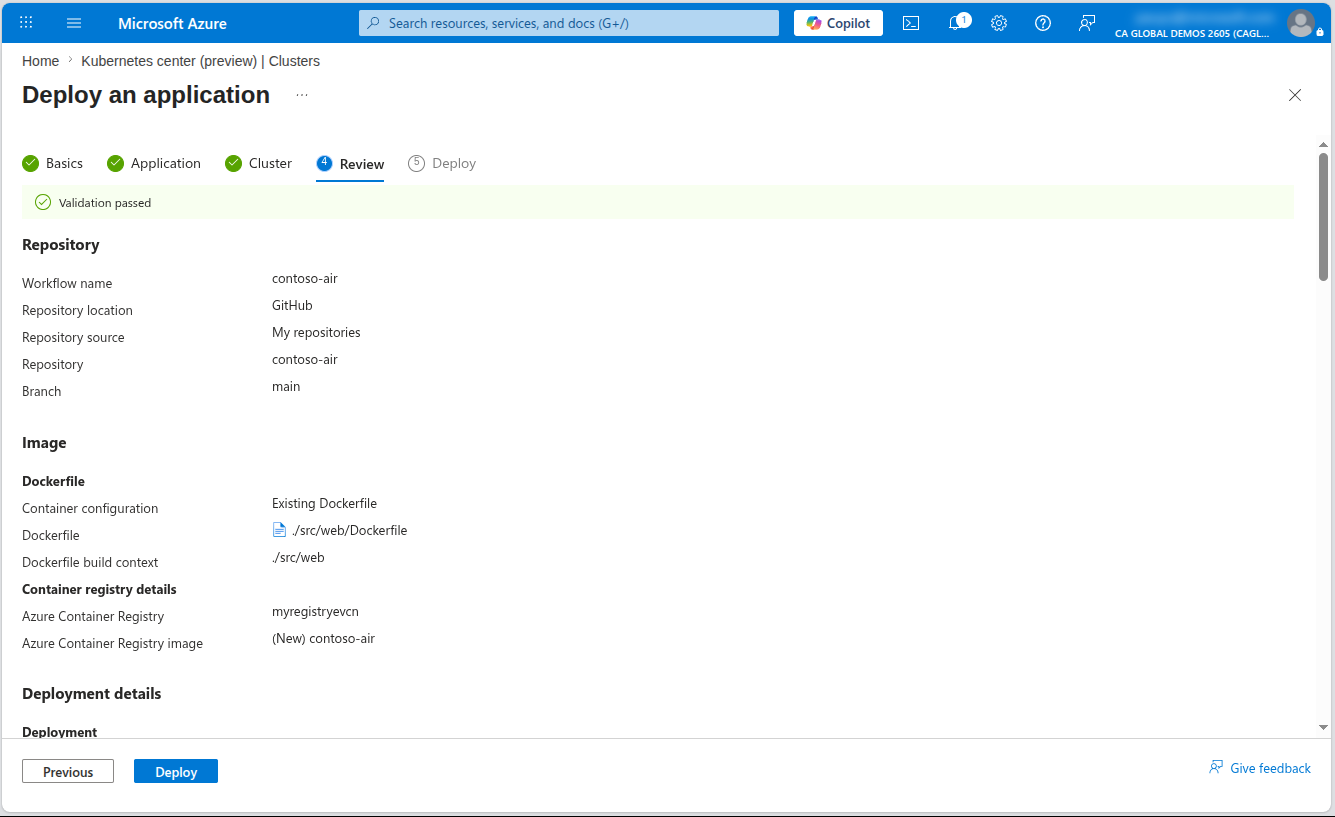
When ready, select the Deploy button to start the deployment.
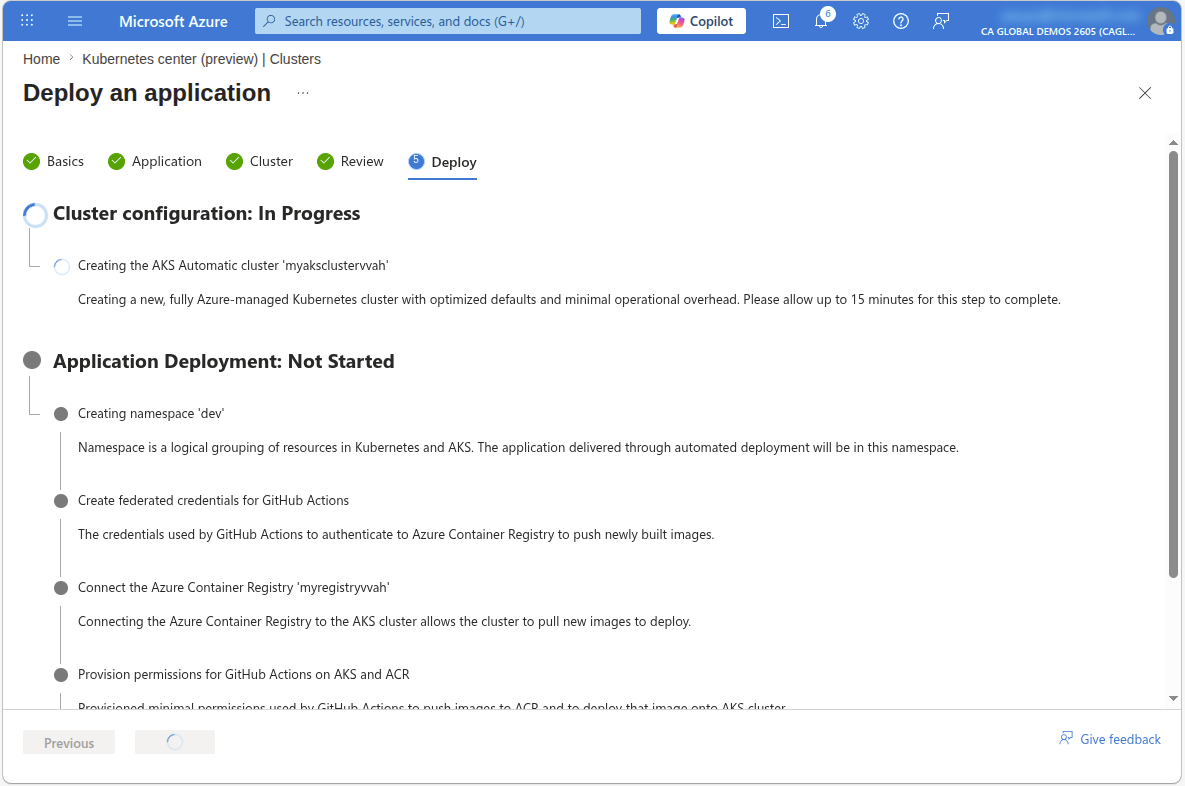
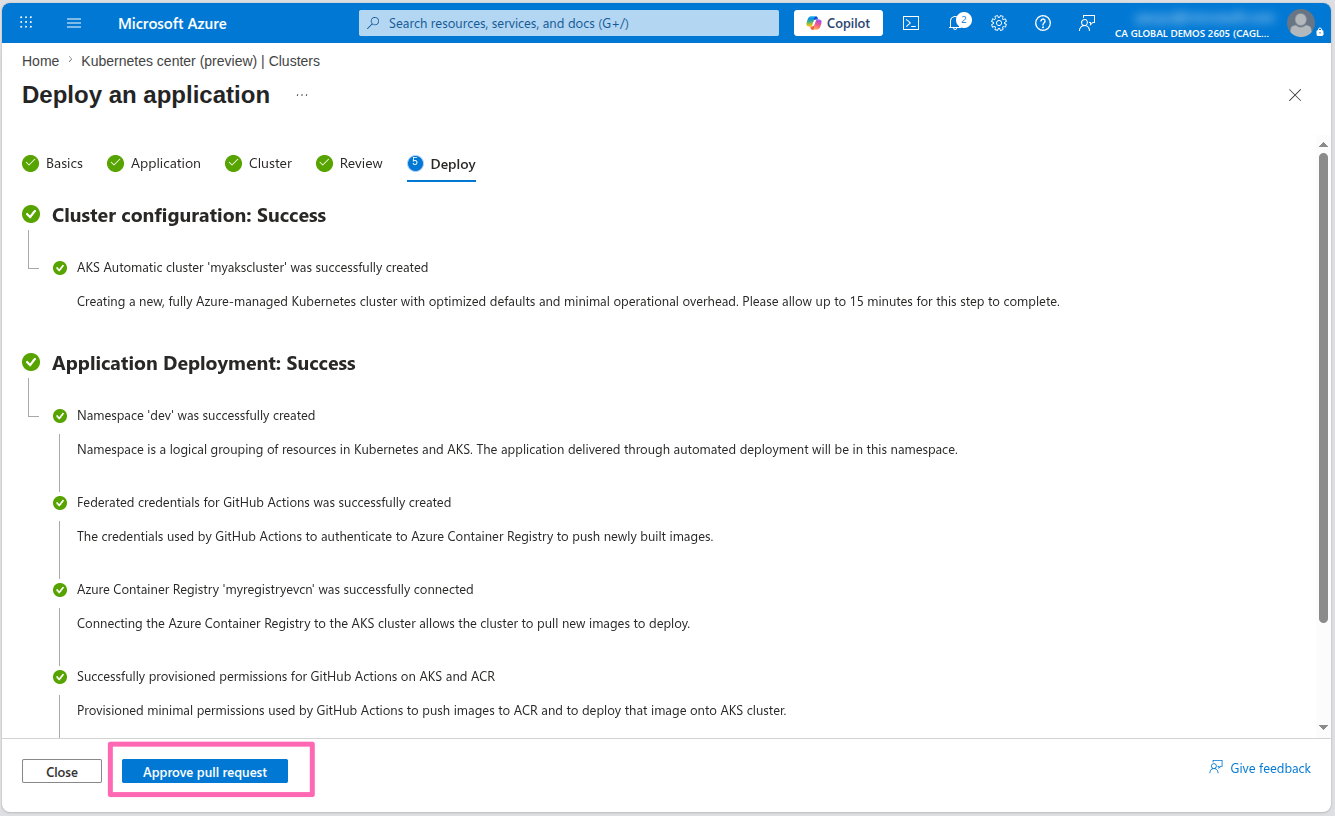
This process can take up to 20 minutes to complete. Do not close the browser window or navigate away from the page until the deployment is complete.
Review the pull request
Once the deployment is complete, select the Approve pull request button to view the pull request to be taken to the pull request page in your GitHub repository.
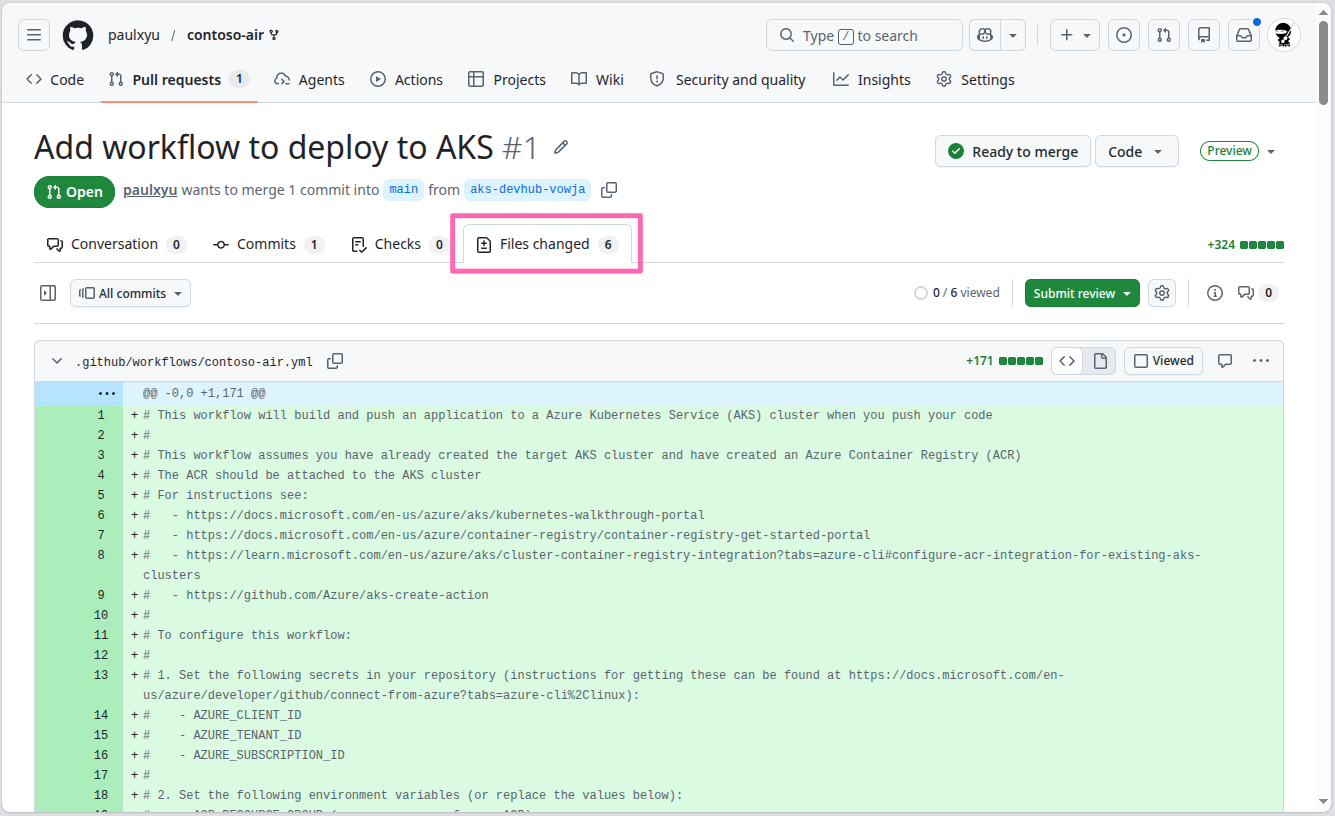
In the pull request review, select the Files changed tab to view the changes that were made by the Automated Deployments workflow.
Scroll down to the manifests/deployment.yaml file to review the Kubernetes deployment manifest that was generated for you. This manifest includes the SYS_PTRACE capability which should be removed for security hardening purposes.
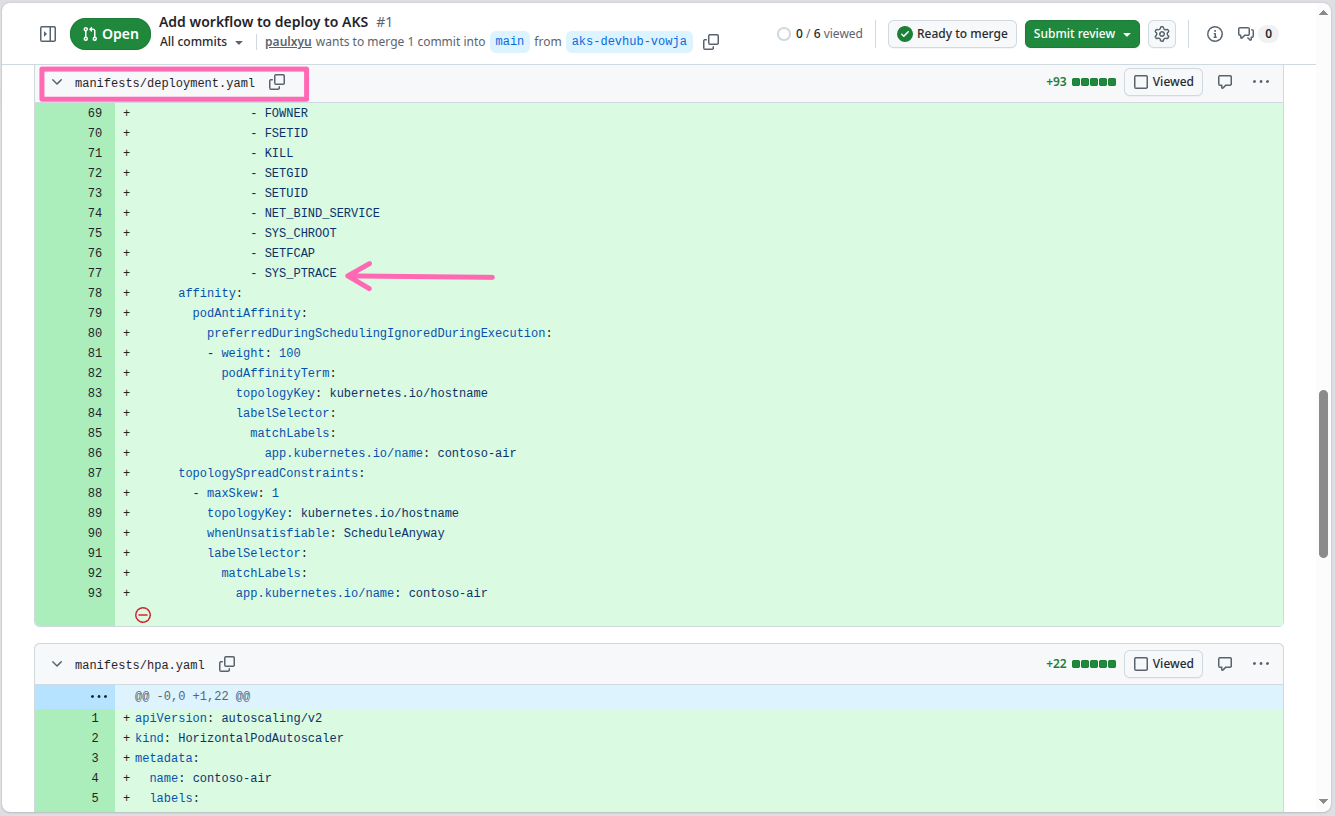
With AKS Automatic, Deployment Safeguards are automatically applied to your cluster. This includes a safeguard that prevents the use of the SYS_PTRACE capability via Kubernetes Pod Security Standards. Any deployment that includes this capability will be blocked. By removing it from the manifest, you ensure that your application deploys successfully while adhering to security best practices. See Kubernetes Pod Security Standards for more information.
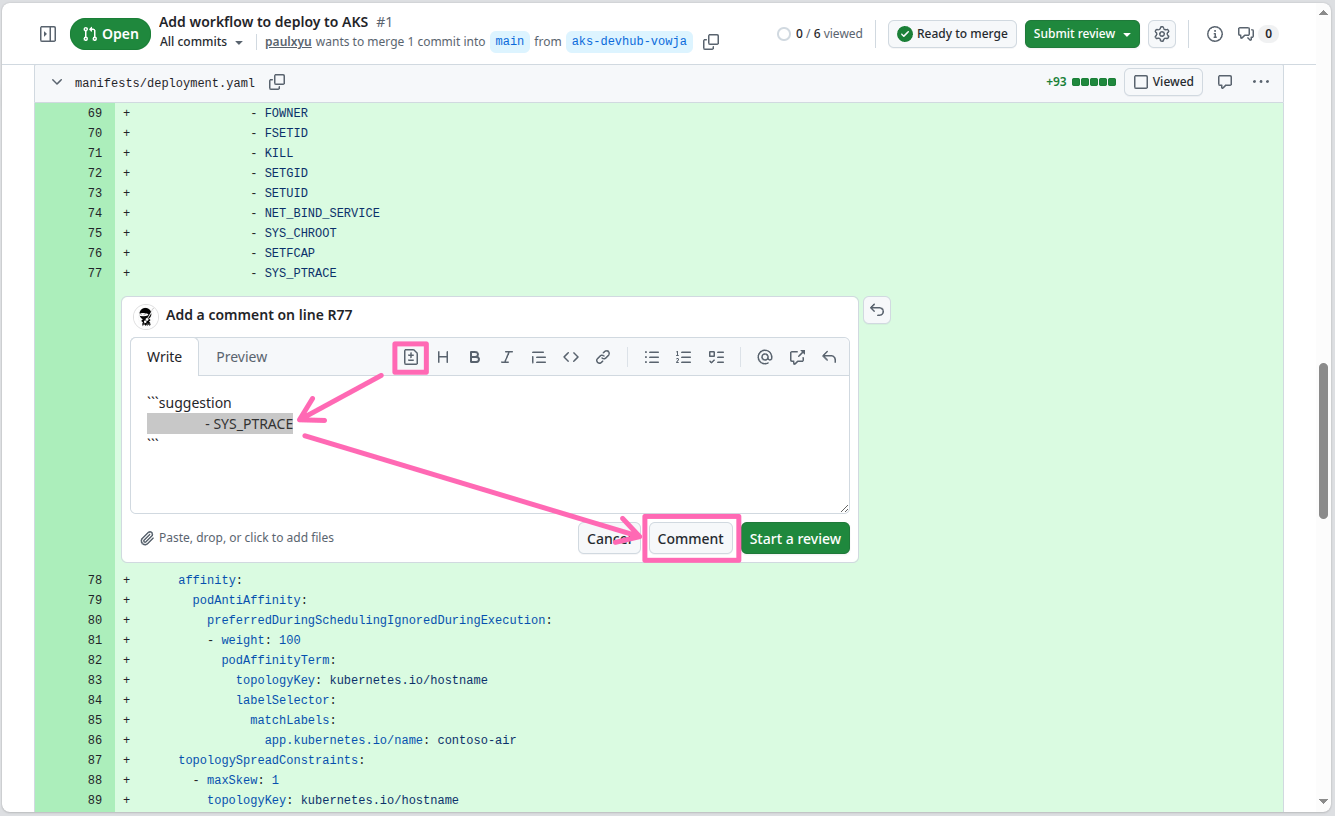
On the line where SYS_PTRACE is added, hover over it and select the plus icon to add a comment.
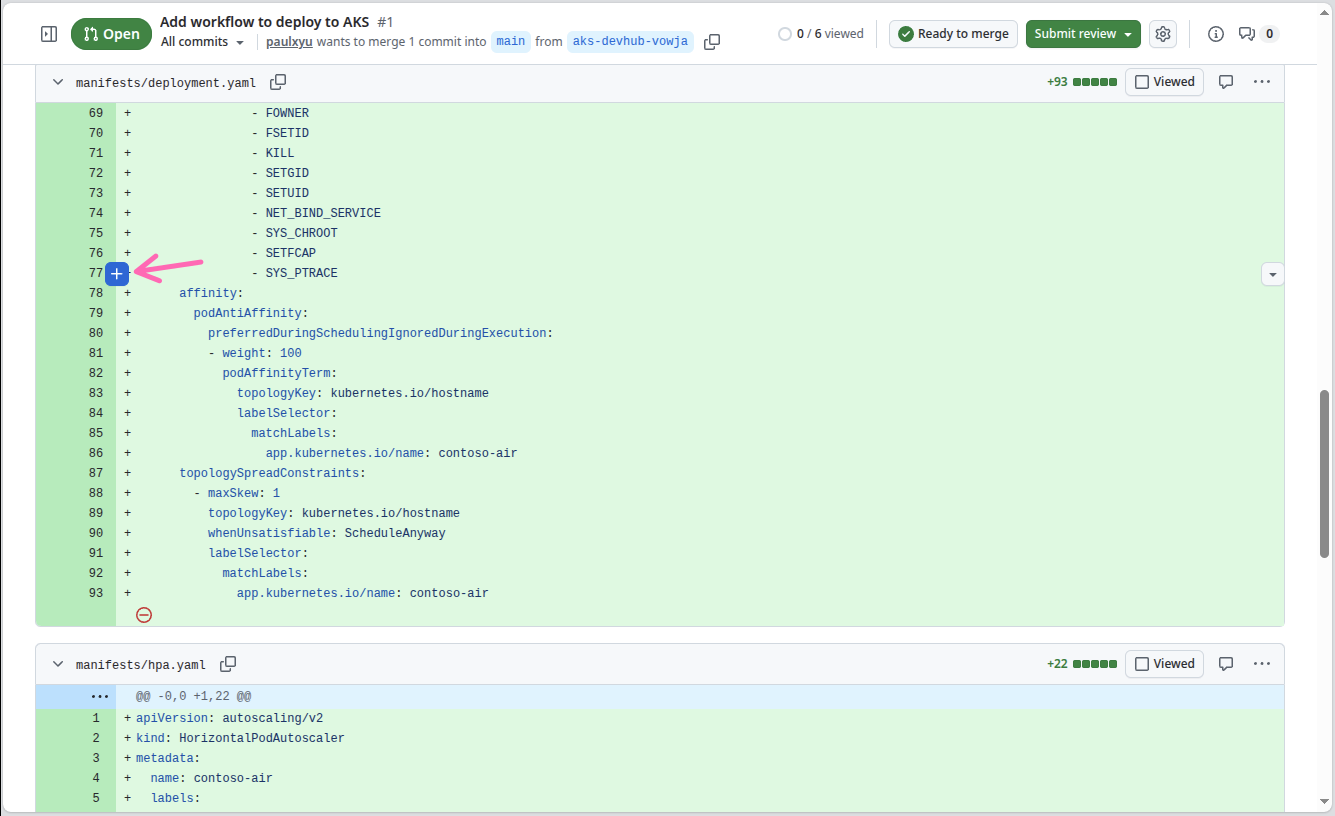
In the comment box, select the Add a suggestion button, then select the contents in the suggestion block and delete the line to remove the capability from the manifest. The suggestion block should now contain an empty line. Select the Comment button to post the comment and suggestion to the pull request.
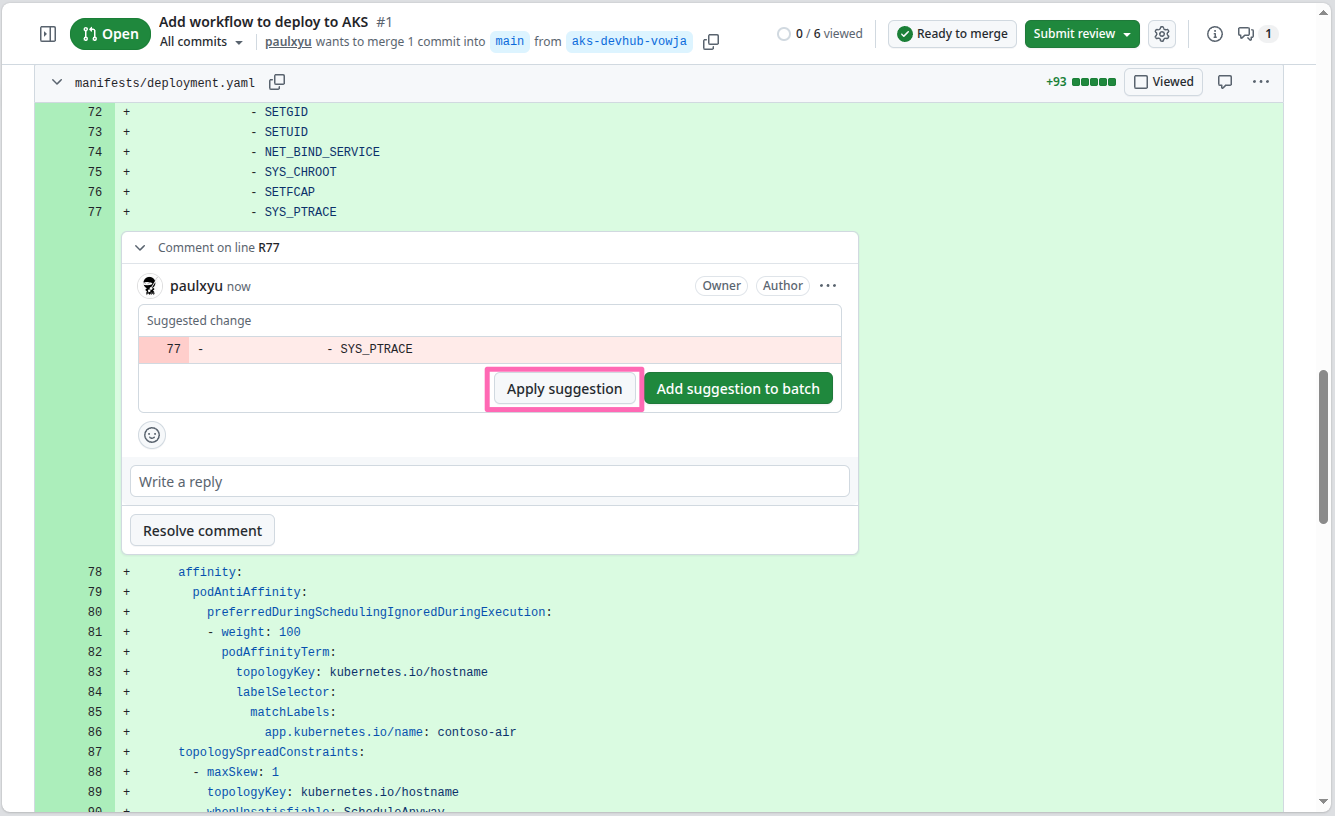
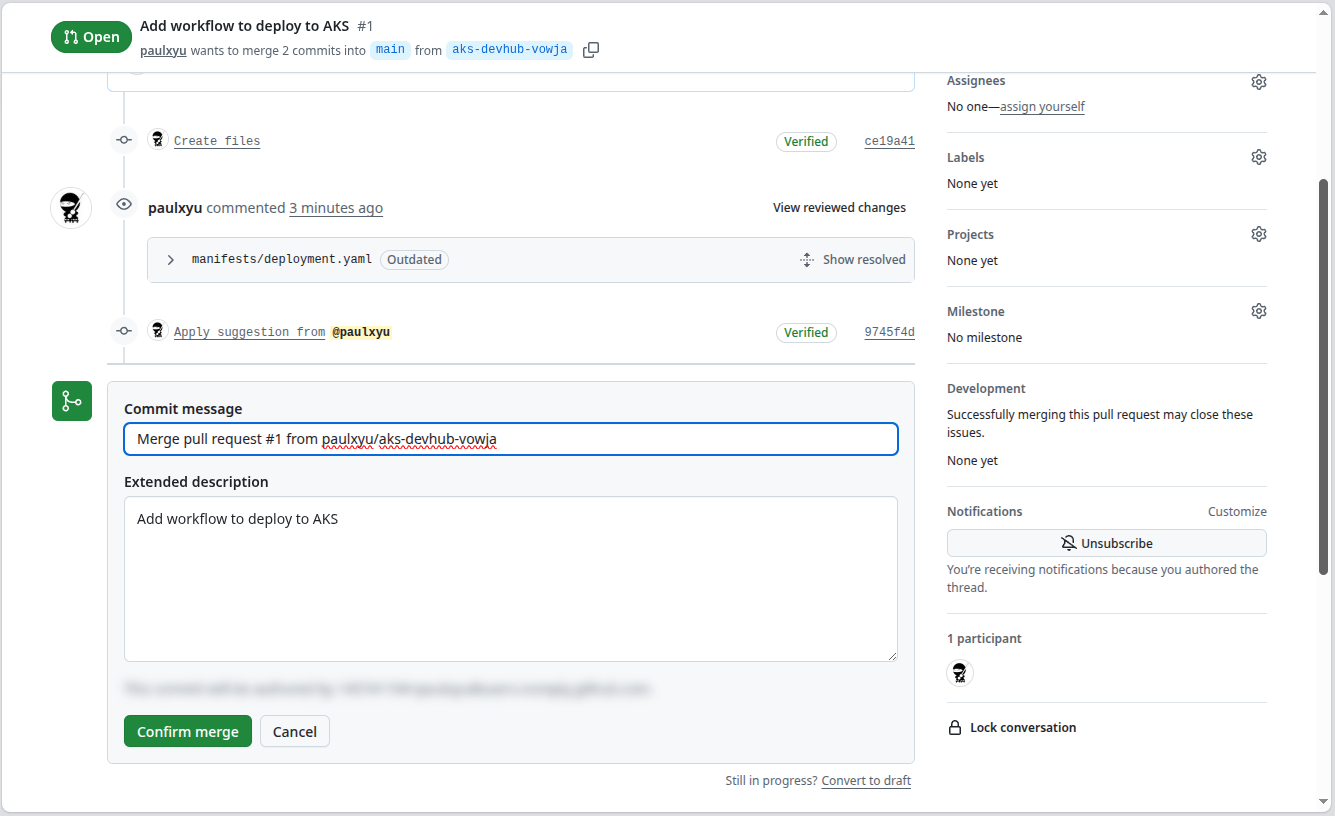
Now select the Apply suggestion button to apply the change to the manifest.
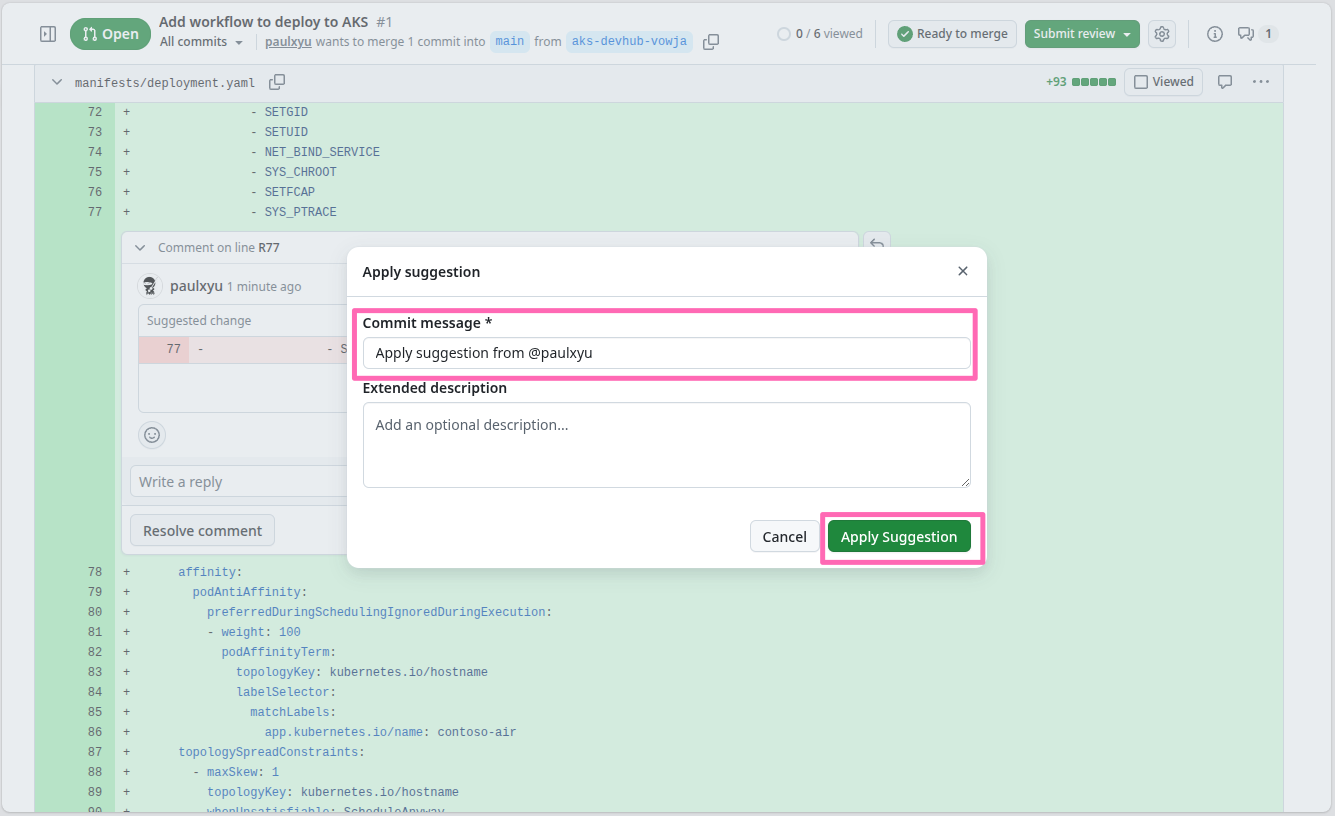
When prompted, keep the default commit message and select the Apply Suggestion button to commit the change to the pull request.
Navigate back to the Conversation tab and select the Merge pull request button to merge the pull request.
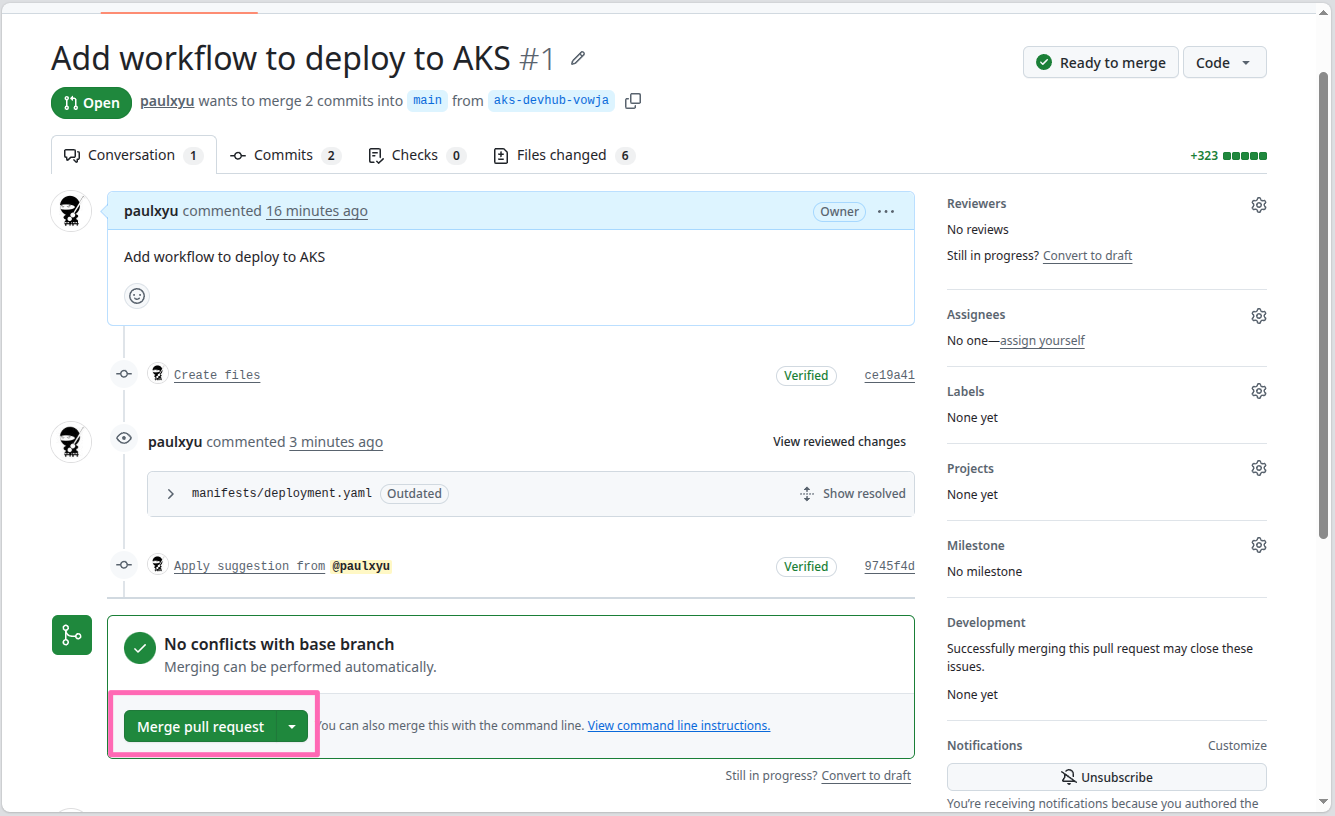
Finally, select the Confirm merge button.
With the pull request merged, the changes will be automatically deployed to your AKS cluster. You can view the deployment logs by selecting the Actions tab in your GitHub repository.
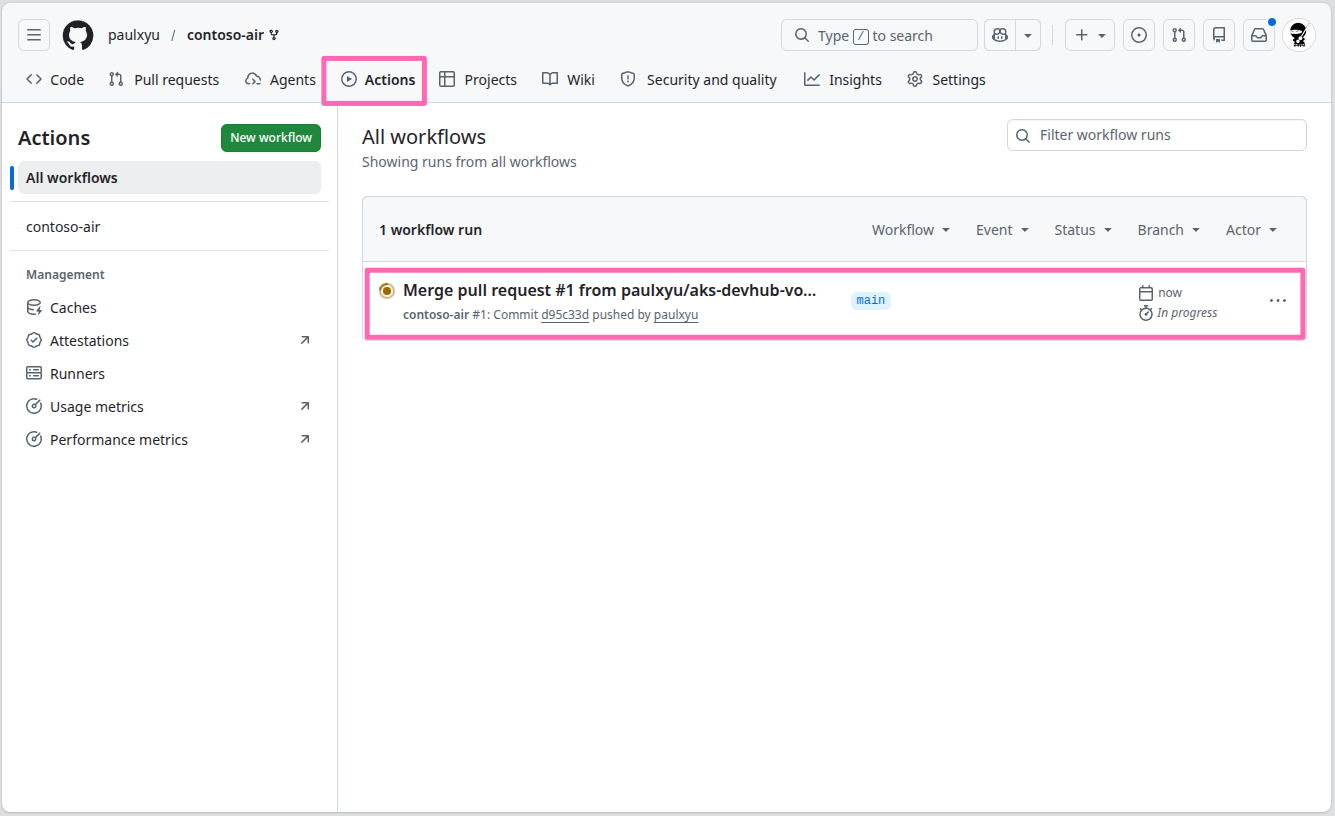
In the Actions tab, you will see the Automated Deployments workflow running. Select the workflow run to view the logs.
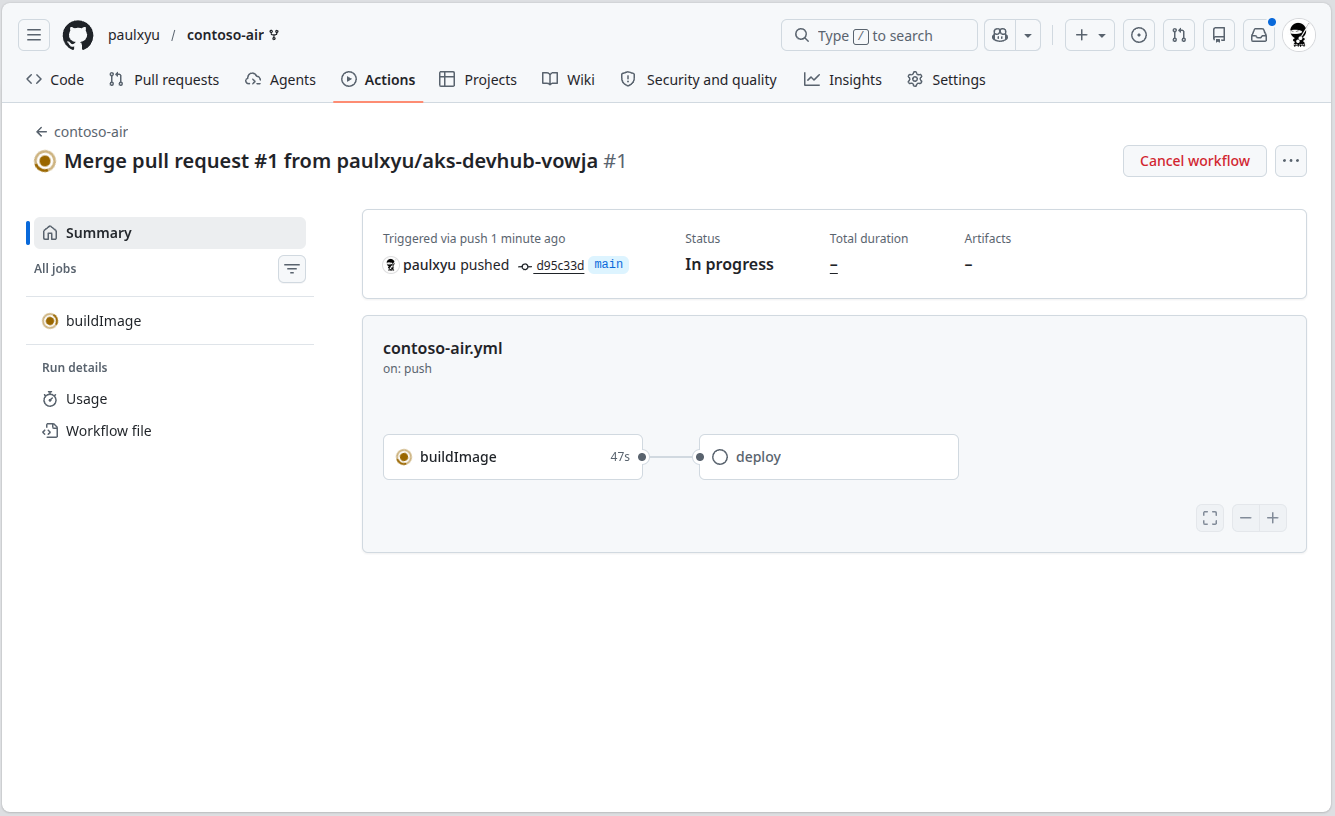
In the workflow run details page, you can view the logs of each job in the workflow by simply selecting the job.
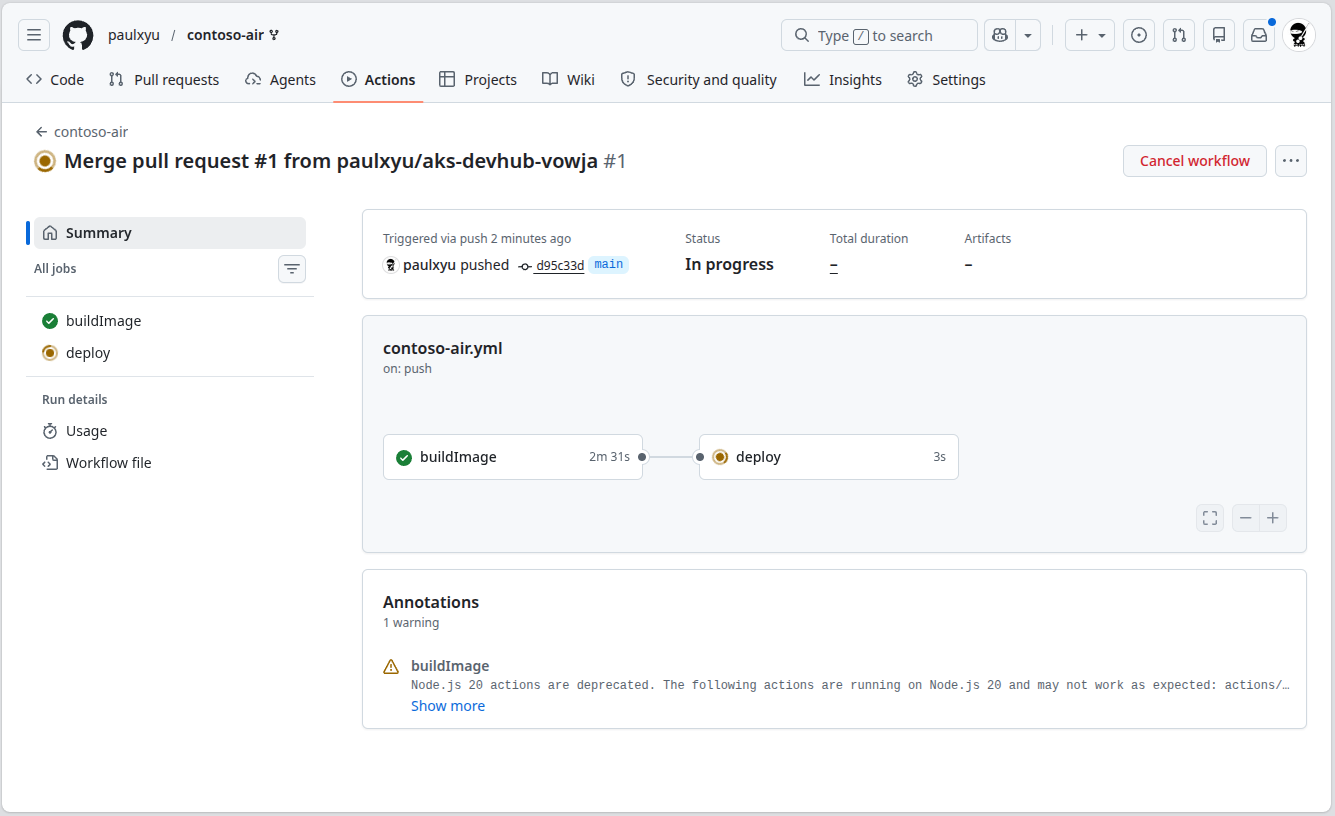
After 5-10 minutes, the workflow will complete and you will see two green check marks next to the buildImage and deploy jobs. This means that the application has been successfully deployed to your AKS cluster.
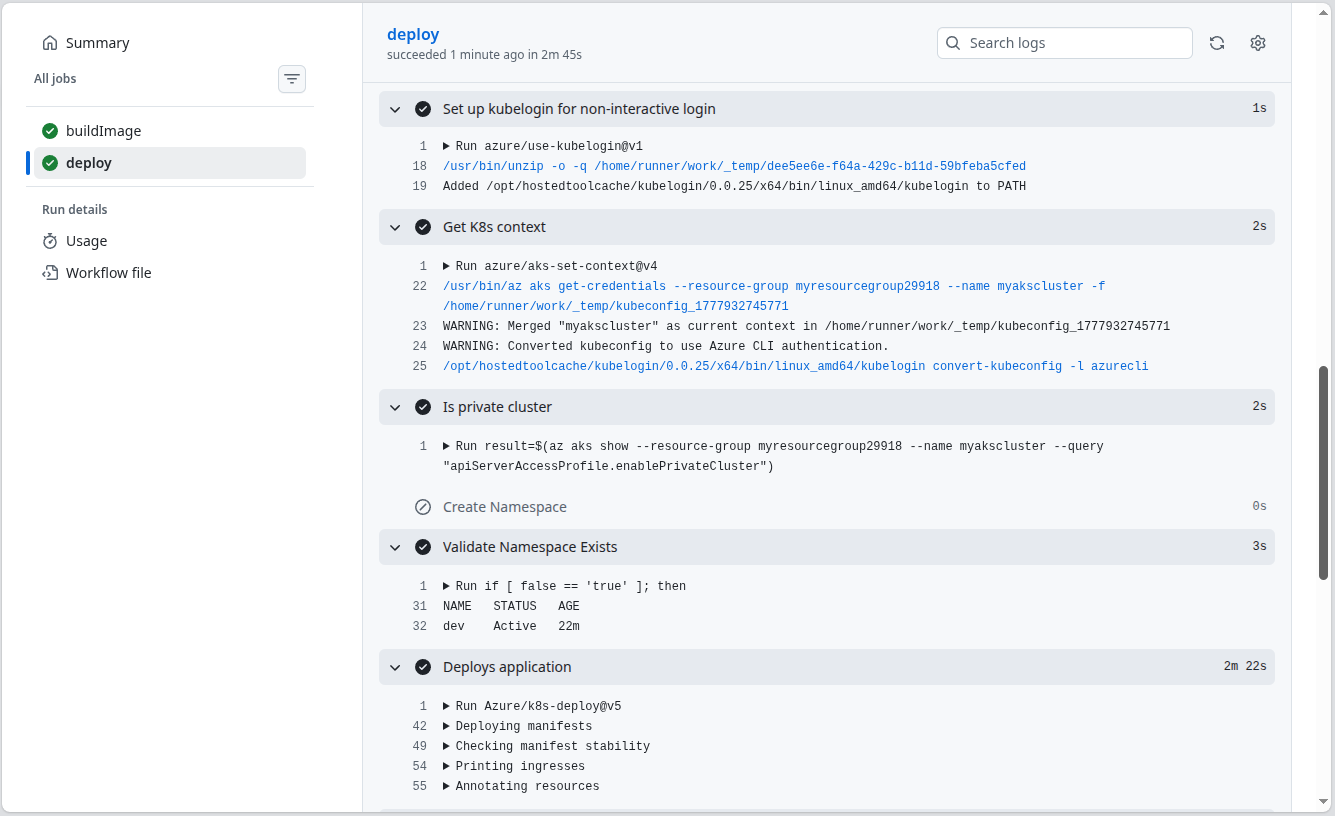
If the deploy job fails, it is likely that Node Autoprovisioning (NAP) is taking a bit longer than usual to provision a new node for the cluster. Try selecting the "Re-run" button at the top of the page to re-run the deploy workflow job.
With AKS Automated Deployments, every time you push application code changes to your GitHub repository, the GitHub Action workflow will automatically build and deploy your application to your AKS cluster. This is a great way to automate the deployment process and ensure that your applications are always up-to-date!
Test the deployed application
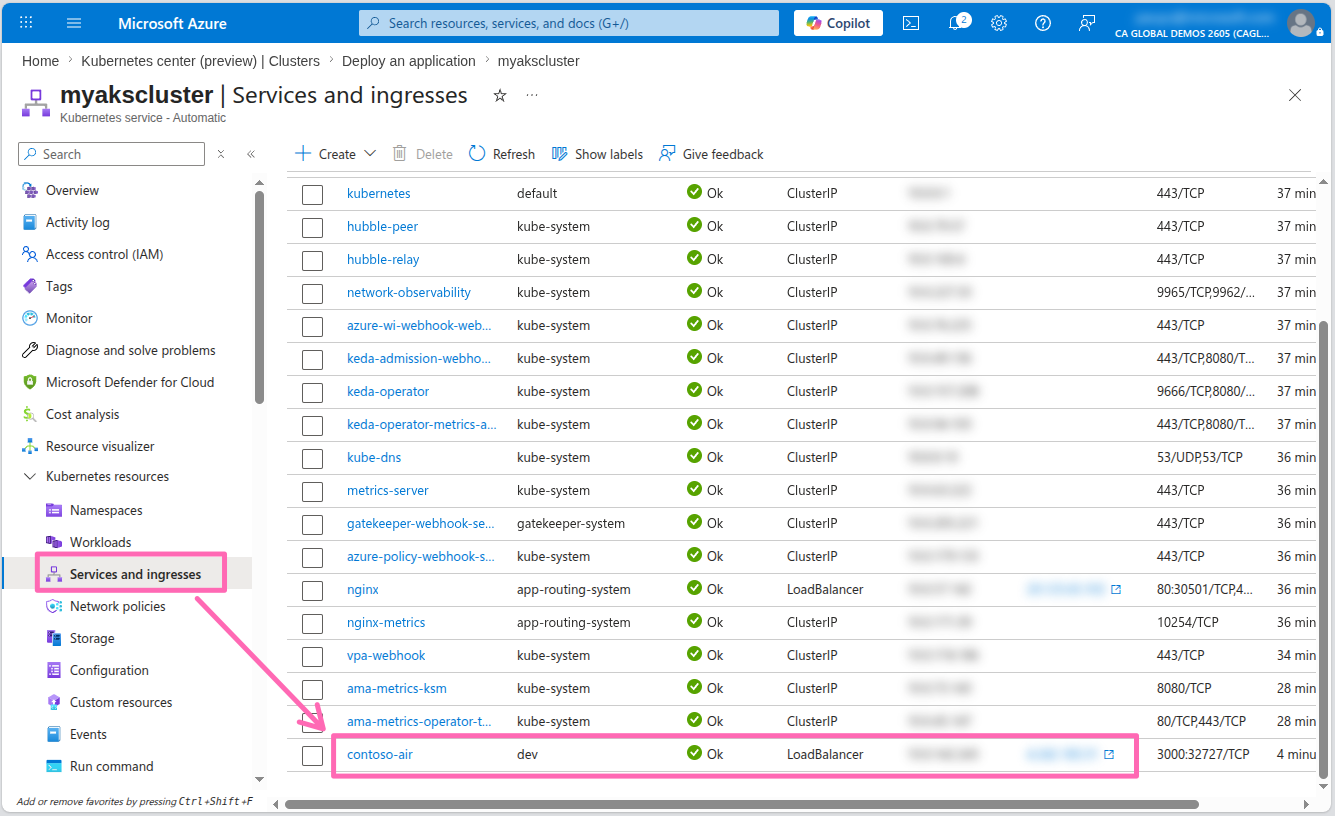
Back in the Azure portal, select the Close button to close the Automated Deployments setup.
In the menu, select Services and ingresses under the Kubernetes resources section. You should see a new service called contoso-air with an external IP address assigned to it. Select the IP address to view the deployed application.
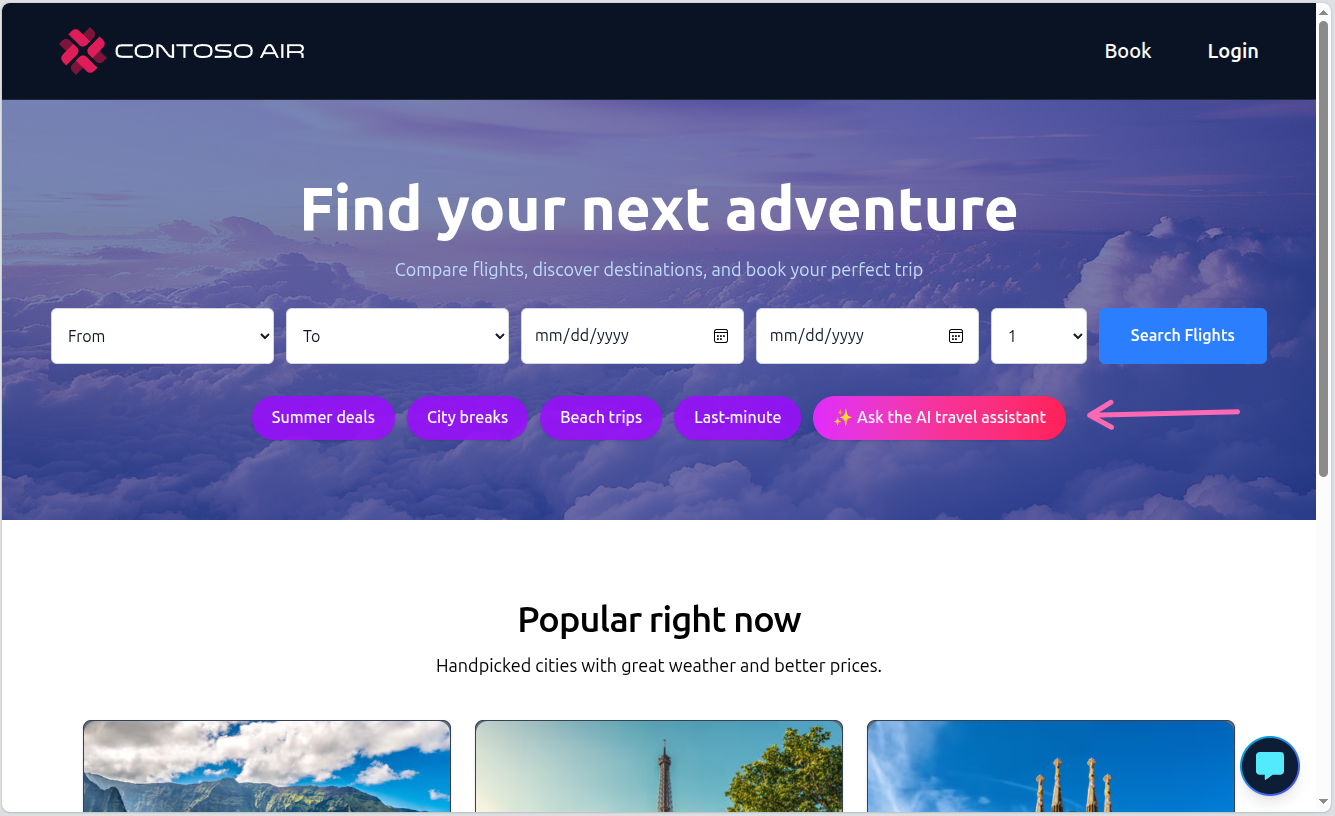
Let's test the application's chat functionality by selecting the Ask the AI travel assistant button.
Attempt to interact with the AI assistant and you'll quickly find that the chat provider is not detected.
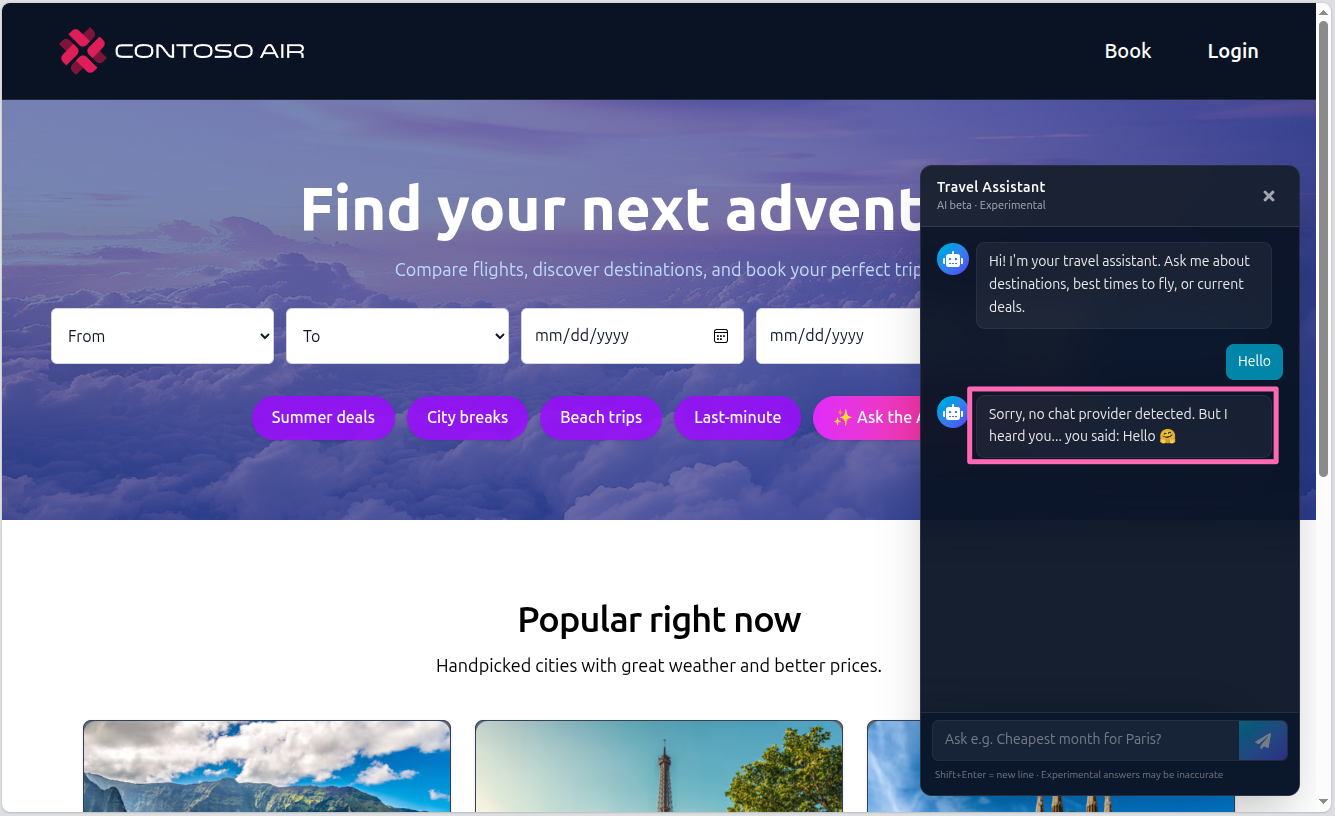
The application needs to be configured to a back-end LLM (for example, Azure OpenAI), but the connection settings are not configured. We can fix this by adding configuration to the application using the AKS Service Connector!
Integrating apps with Azure services
AKS Service Connector streamlines connecting applications to Azure resources like Azure OpenAI by automating the configuration of Workload Identity. It assigns identities to pods, enabling them to authenticate with Microsoft Entra ID and access Azure services securely without passwords. For a deeper understanding, check out the Workload Identity overview.
Workload Identity is the recommended way to authenticate with Azure services from your applications running on AKS. It is more secure than using service principals and does not require you to manage credentials in your application. To read more about the implementation of Workload Identity for Kubernetes, see the Azure Workload Identity documentation.
Application configuration
A ConfigMap is a Kubernetes resource that stores non-confidential configuration data as key-value pairs. Applications running in pods can read these values as environment variables, making it easy to change application behavior without rebuilding the container image.
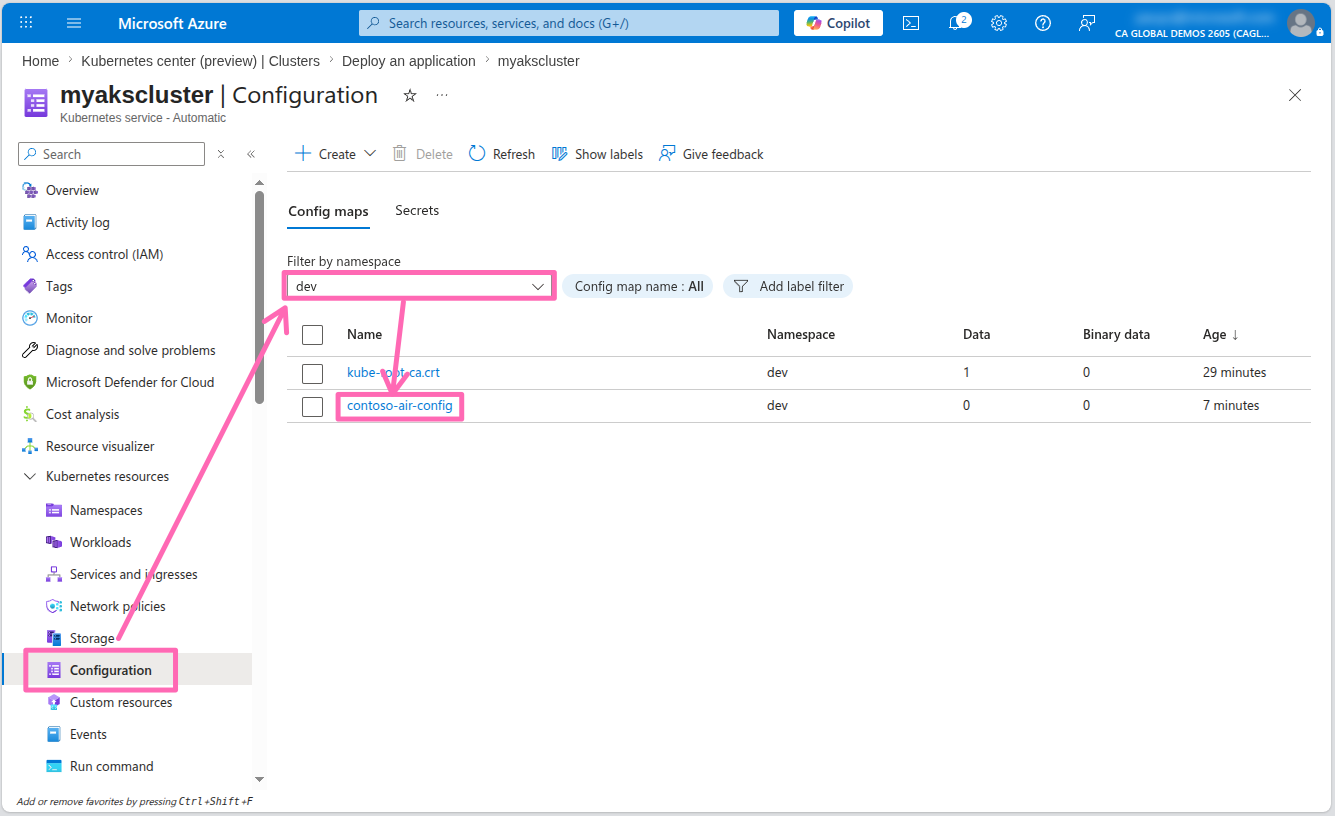
Add configuration to the application to specify Azure OpenAI as the chat provider and the model deployed earlier. You can do this in the Azure portal by navigating to the Configuration section under Kubernetes resources in the menu, filtering by the dev namespace, and selecting the contoso-air-config config map.
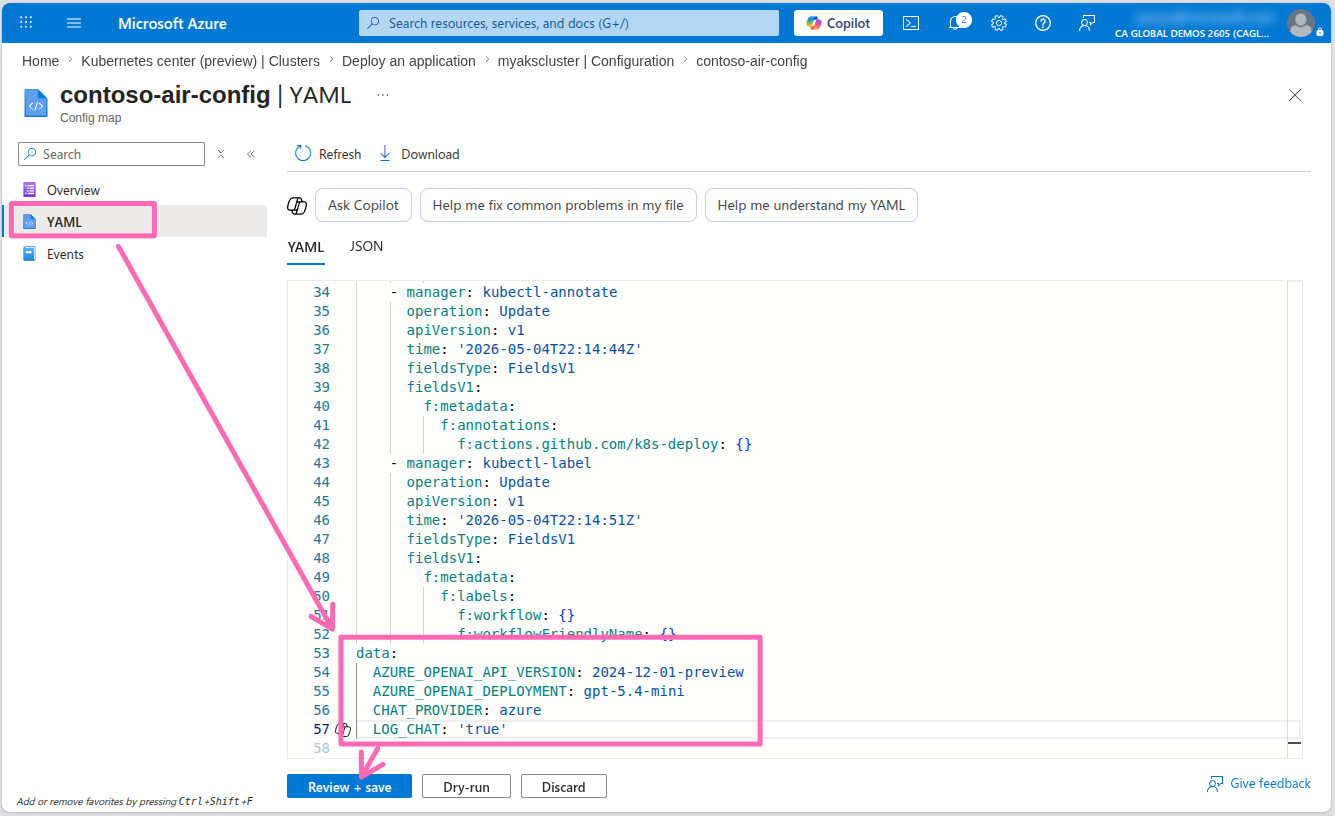
Select the YAML tab, then in the YAML editor, add the following configuration to the end of the file, then select Review + save.
data:
  AZURE_OPENAI_API_VERSION: 2024-12-01-preview
  AZURE_OPENAI_DEPLOYMENT: gpt-5.4-mini
  CHAT_PROVIDER: azure
  LOG_CHAT: 'true'
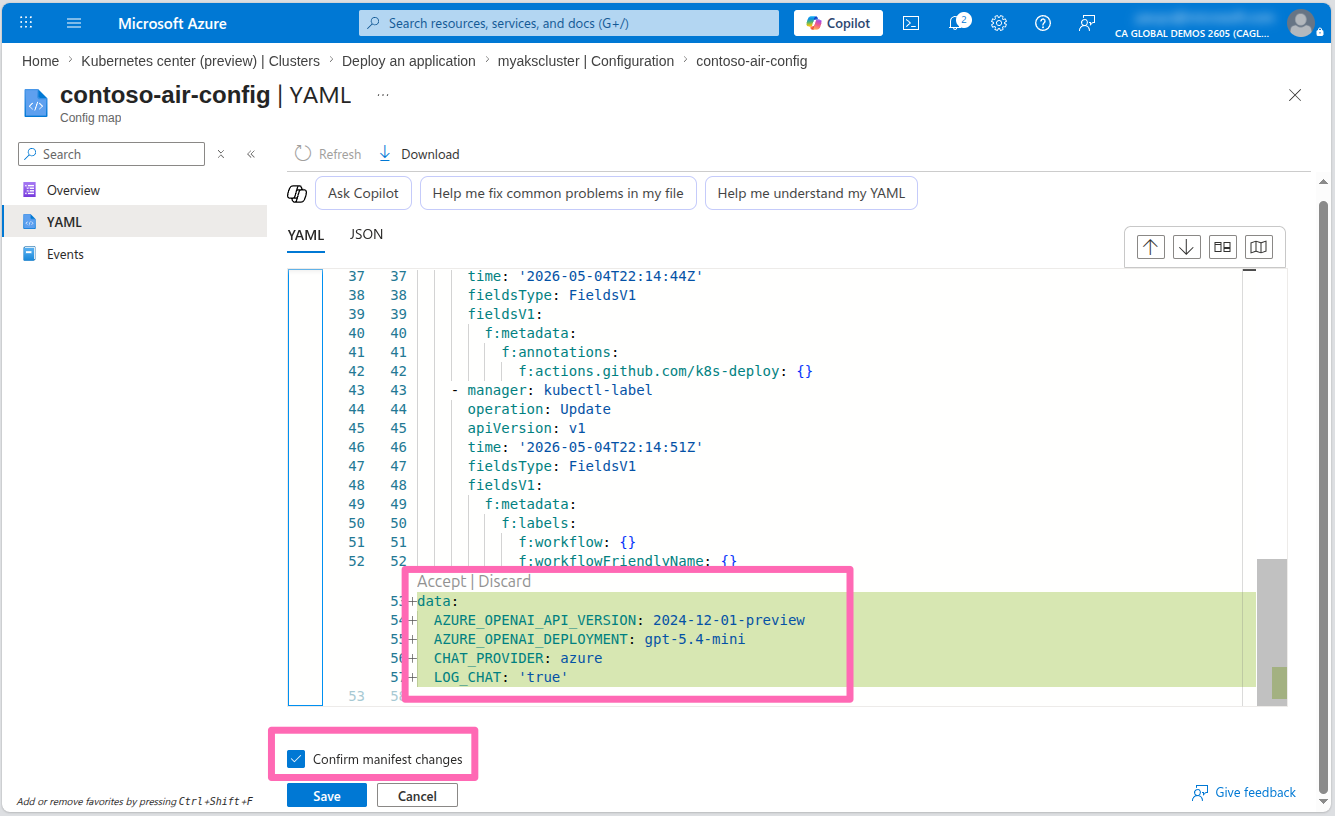
You will be prompted to confirm the changes. Scroll all the way down to the bottom of the page to review the changes, then check the Confirm manifest changes checkbox and select Save.
This configmap was created by the Automated Deployments workflow earlier. The new configuration settings you added will instruct the application to use Azure OpenAI as the chat provider and specify the deployment name of the model to use and the contoso-air application is already configured to read these settings and inject them into the application environment.
Service Connector setup
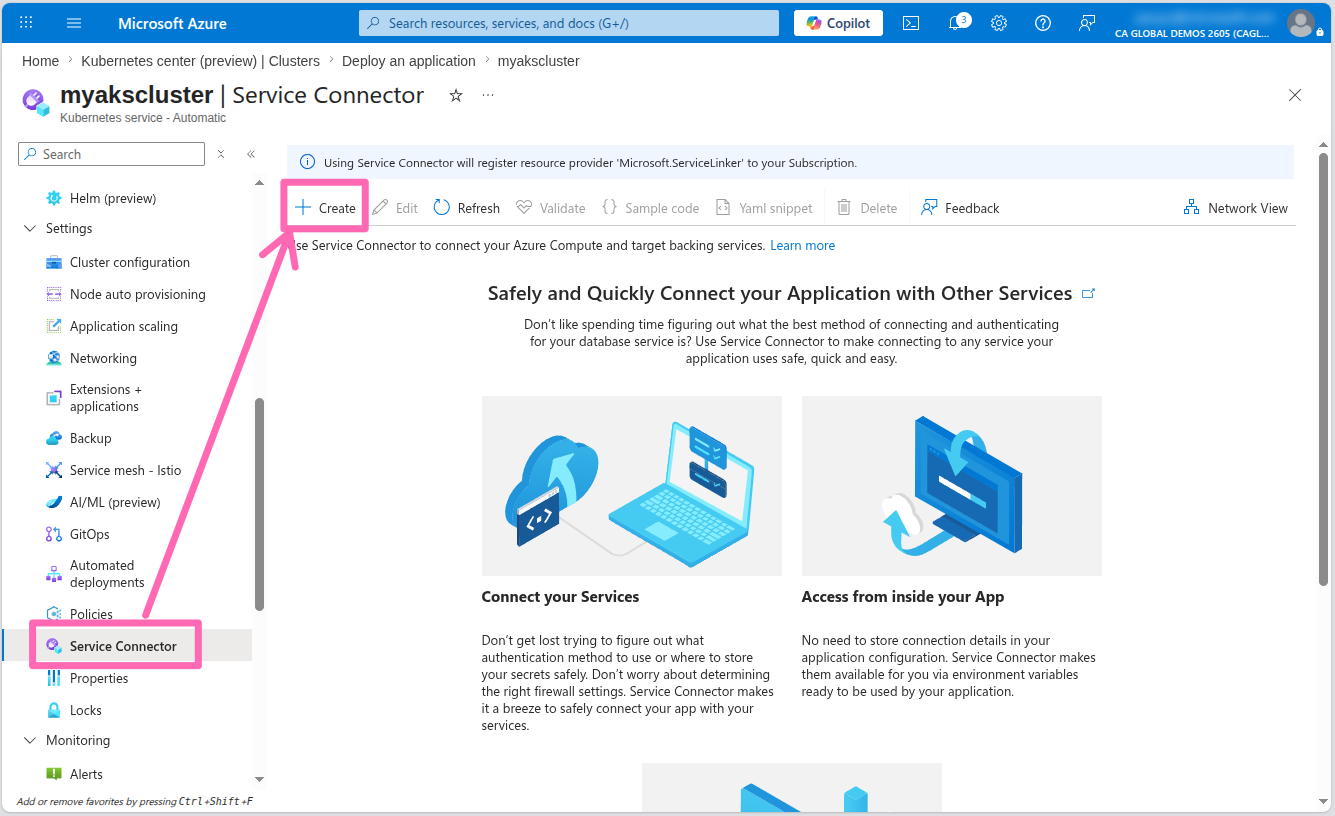
In the menu, select Service Connector under Settings then select the + Create button.
In the Basics tab, enter the following details:
- Kubernetes namespace: Enter
dev - Service type: Select OpenAI Service
- OpenAI: Select the Azure OpenAI account you created earlier
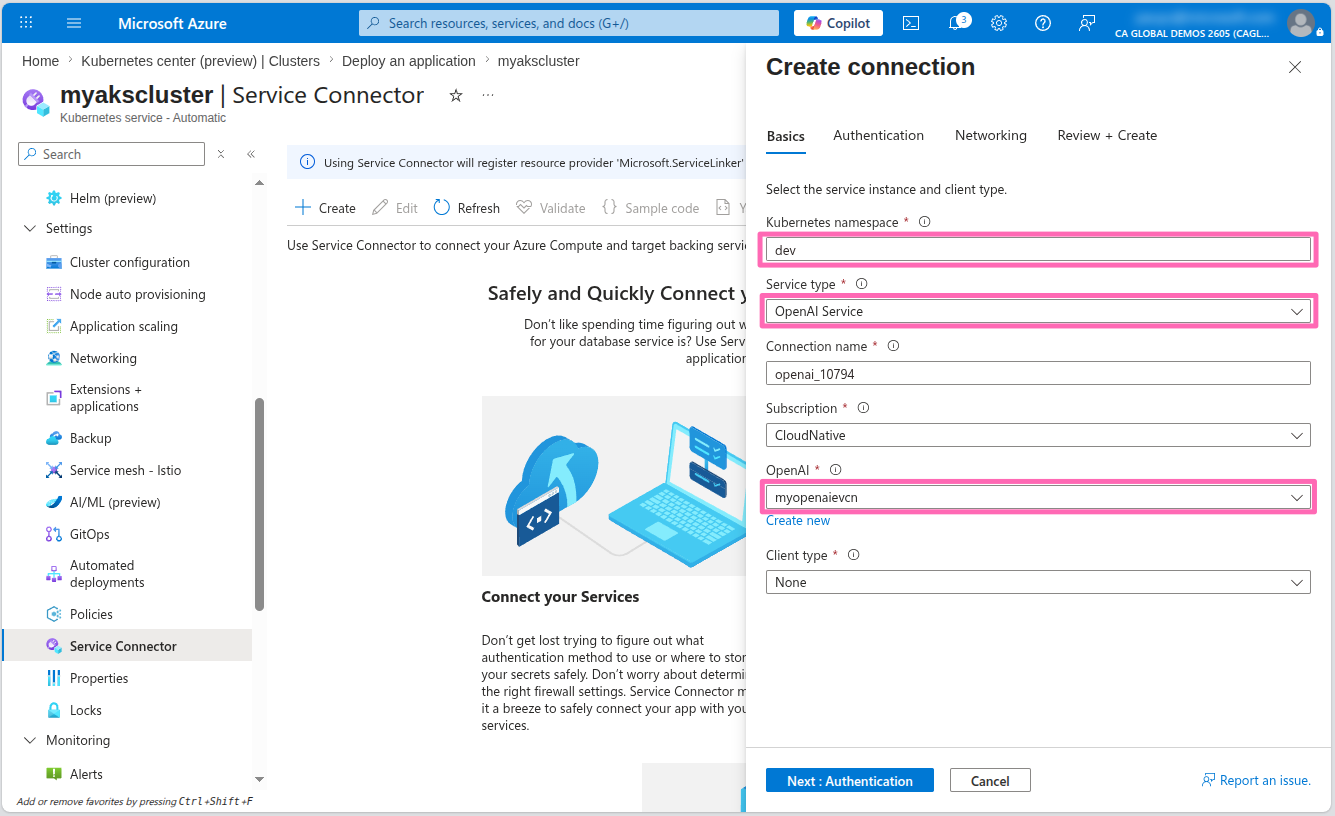
Select Next: Authentication.
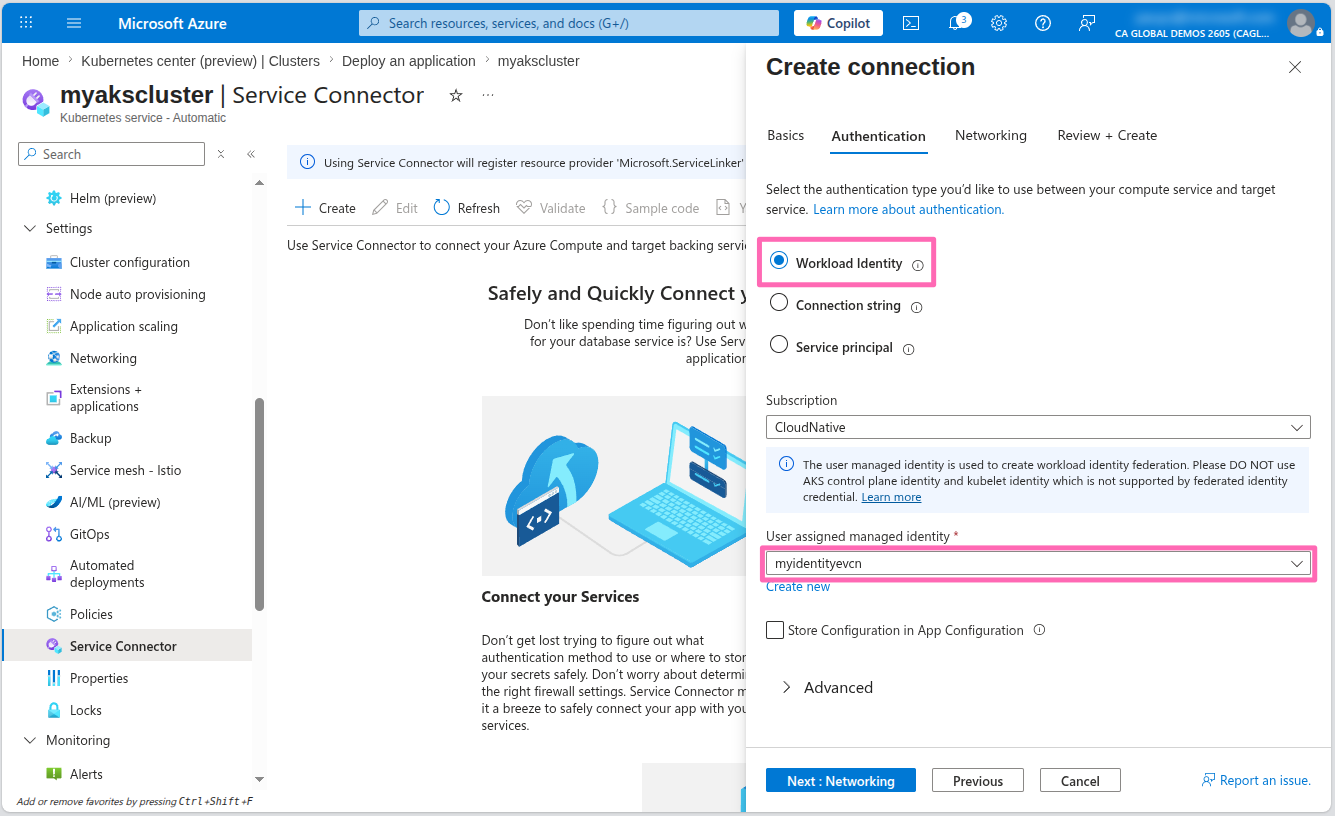
In the Authentication tab, select the Workload Identity option. You should see a user-assigned managed identity that was created during your lab setup. If no managed identities appear in the dropdown, select the Create new link to provision a new one.
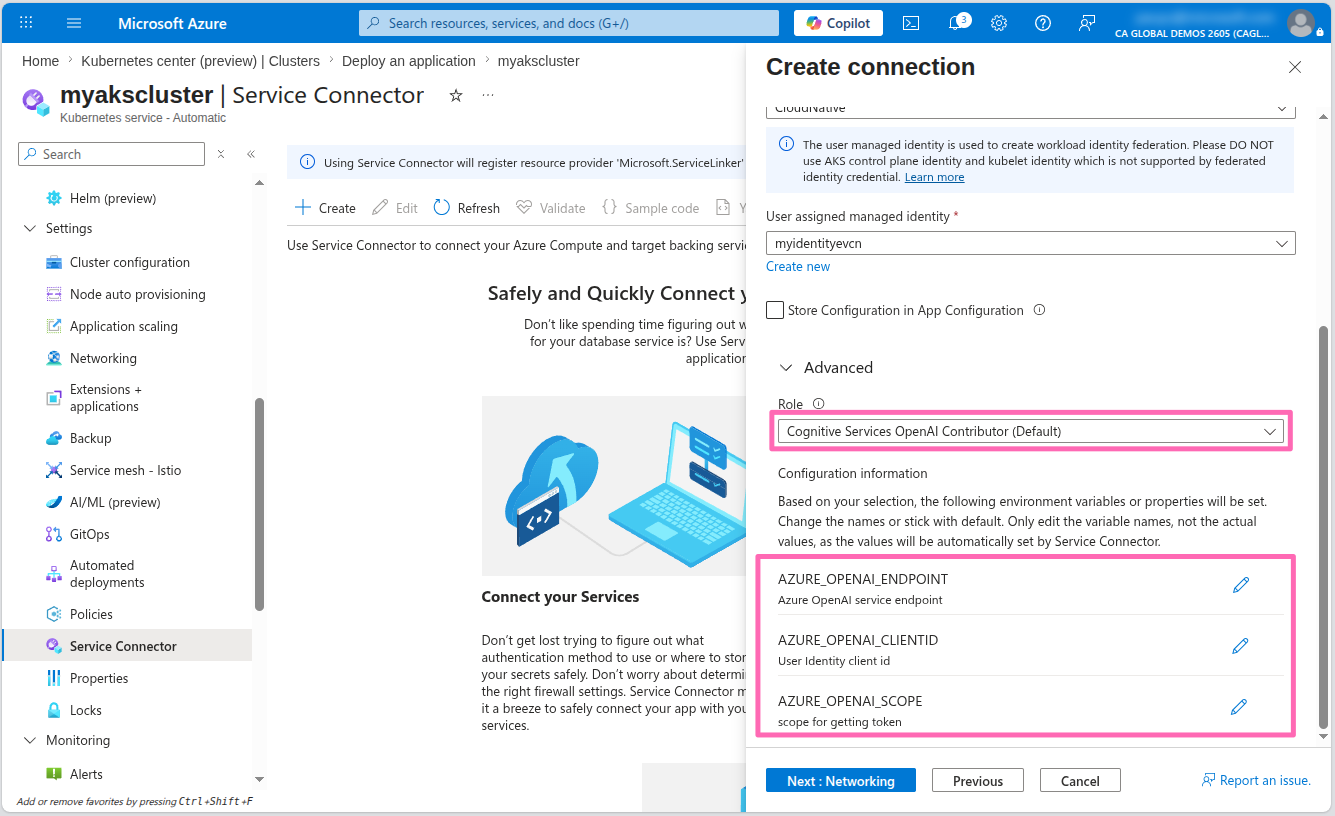
Optionally, you can expand the Advanced section to customize the managed identity settings. By default, the Cognitive Services OpenAI Contributor role is assigned, granting the workload identity permissions to authenticate and interact with your LLM. You'll also notice there's additional configuration information that Service Connector will set as environment variables in the application. These variables will be saved to a Kubernetes Secret which will then be used to configure the connection to the Azure OpenAI account.
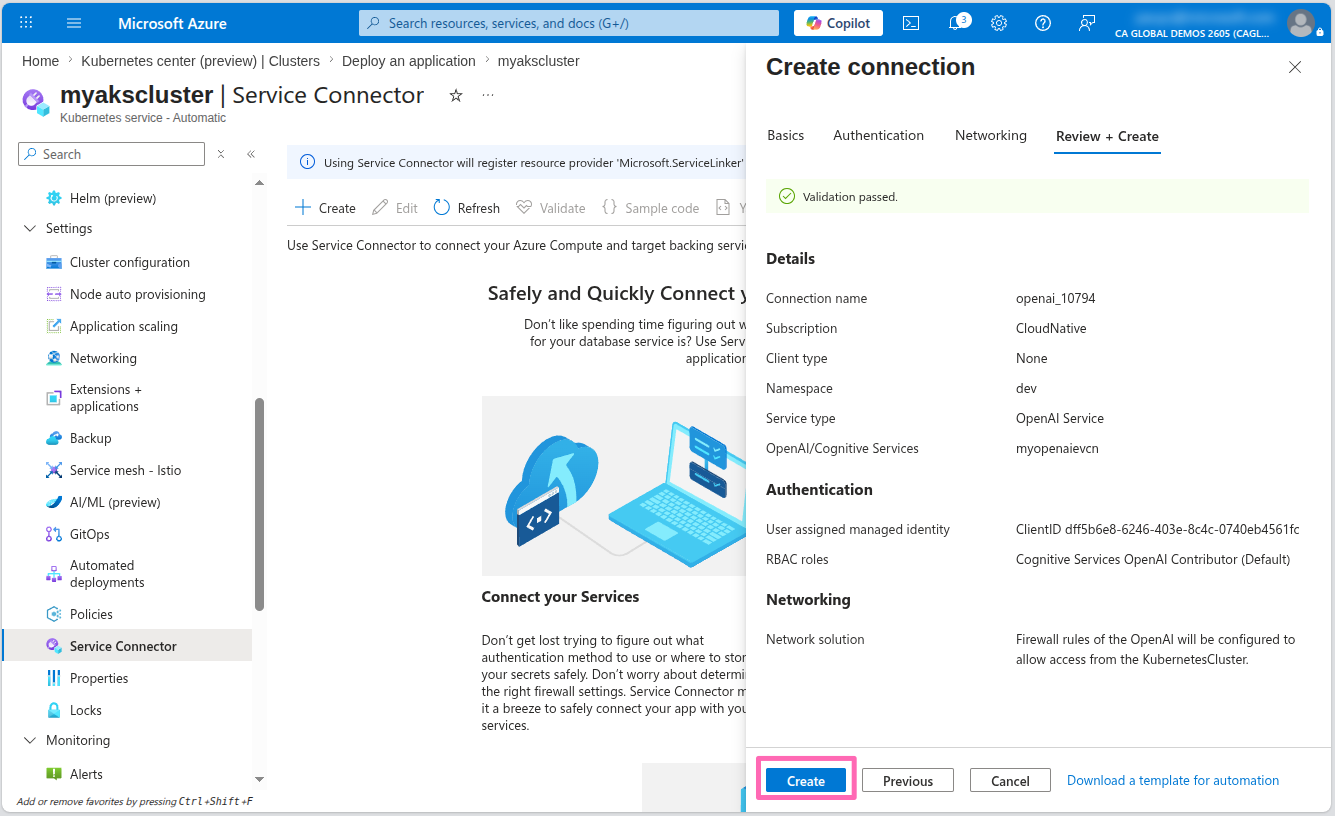
Select Next: Networking then select Next: Review + create and finally select Create.
This process will take a few minutes while Service Connector configures the Workload Identity infrastructure. Behind the scenes, it's:
- Assigning appropriate Azure role permissions to the managed identity for Azure OpenAI access
- Creating a Federated Credential that establishes trust between your Kubernetes cluster and the managed identity
- Setting up a Kubernetes ServiceAccount linked to the managed identity
- Creating a Kubernetes Secret containing the Azure OpenAI connection information
Configure the application for Workload Identity
Once you've successfully set up the Service Connector for your Azure OpenAI account, it's time to configure your application to use these connection details.
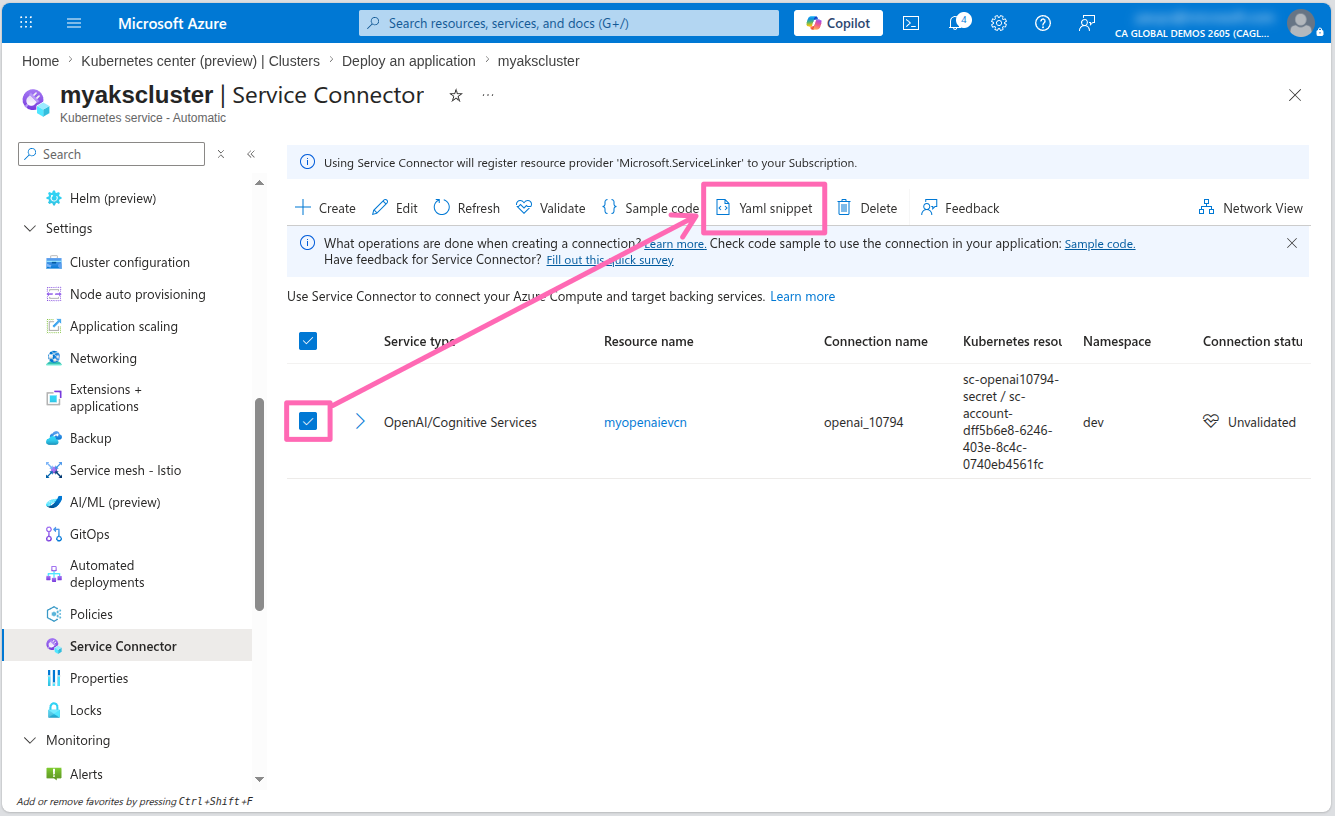
In the Service Connector page, select the checkbox next to the OpenAI connection and select the Yaml snippet button.
In the YAML snippet window, select Kubernetes Workload for Resource type, then select contoso-air for Kubernetes Workload.
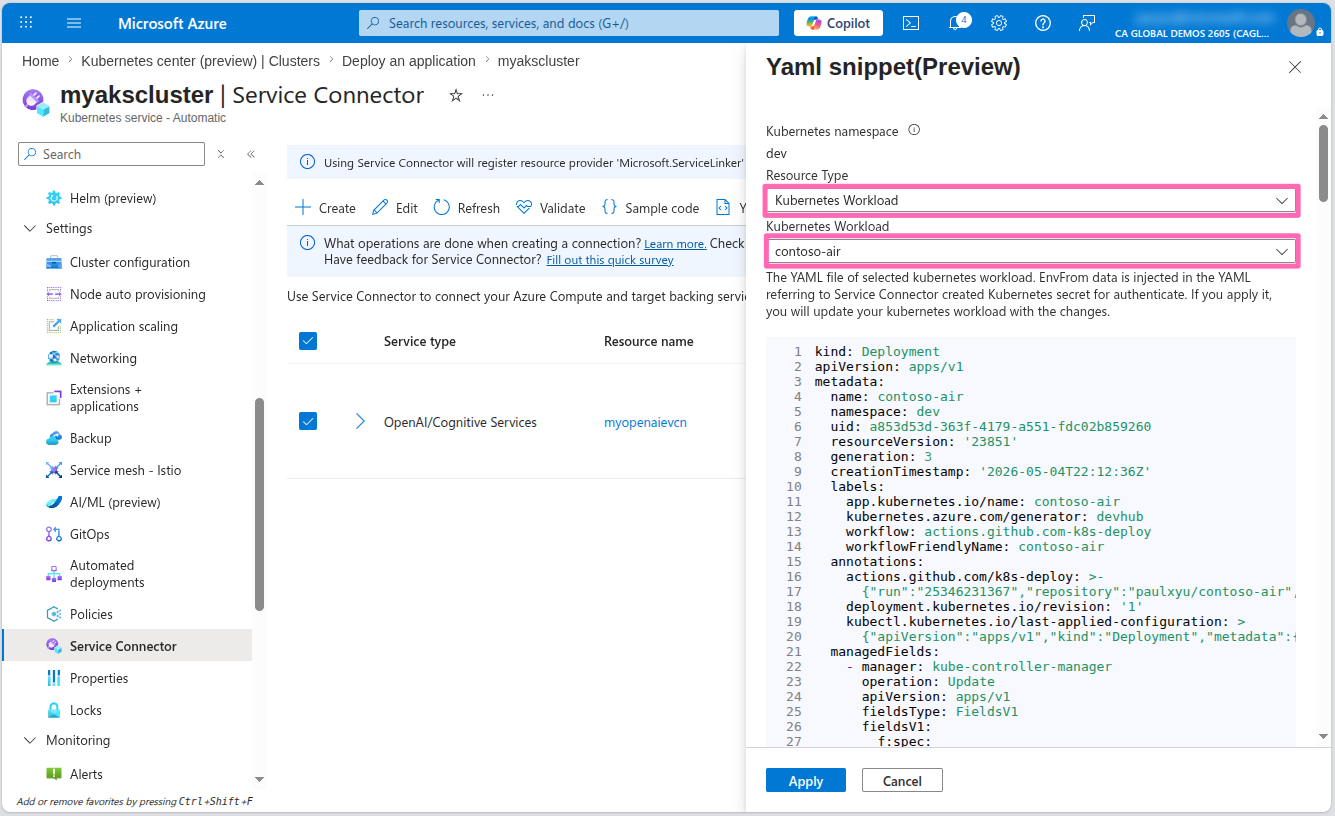
You will see the YAML manifest for the contoso-air application with the highlighted edits required to connect to Azure OpenAI via Workload Identity.
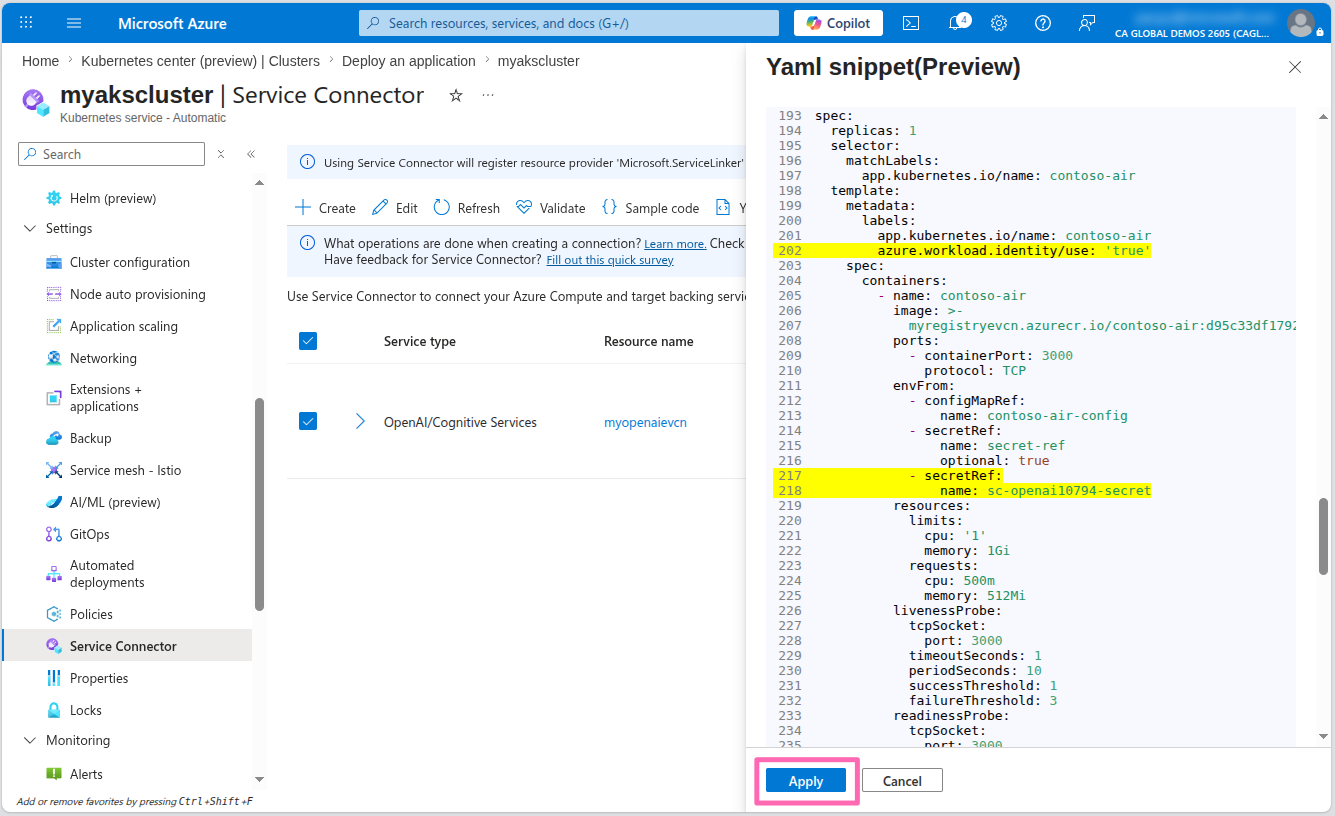
Scroll through the YAML manifest to view all the changes highlighted in yellow, then select Apply to apply the changes to the application. This will redeploy the contoso-air application with the new connection details.
This will apply changes directly to the application deployment but ideally you would want to commit these changes to your repository so that they are versioned and can be tracked and automatically deployed using the Automated Deployments workflow that you set up earlier.
Wait a minute or two for the new pod to be rolled out then navigate back to the application and attempt to interact with the AI assistant. Now, you should be able to chat with an AI assistant without any errors!

Observing your cluster and apps
Monitoring and observability are key components of running applications in production. AKS Automatic provides many monitoring and observability features out-of-the-box. Let's take a closer look at how you can monitor and observe your application and cluster.
At the start of the workshop, you integrated the AKS Automatic cluster with Azure Log Analytics Workspace for logging and Azure Monitor Managed Workspace for metrics collection. AKS also provides built-in Grafana dashboards for data visualization.
Now, you can also enable the Azure Monitor Application Insights for AKS feature to automatically instrument your applications with Azure Application Insights.
App monitoring
Azure Monitor Application Insights is an Application Performance Management (APM) solution for real-time monitoring of your applications. It uses OpenTelemetry (OTel) to collect telemetry data and stream it to Azure Monitor, helping you evaluate performance, pinpoint bottlenecks, and gain actionable insights. With AKS, the AutoInstrumentation feature collects telemetry without requiring any code changes.
At the time of this writing, the AutoInstrumentation feature is in public preview. Please refer to the official documentation for the most up-to-date information.
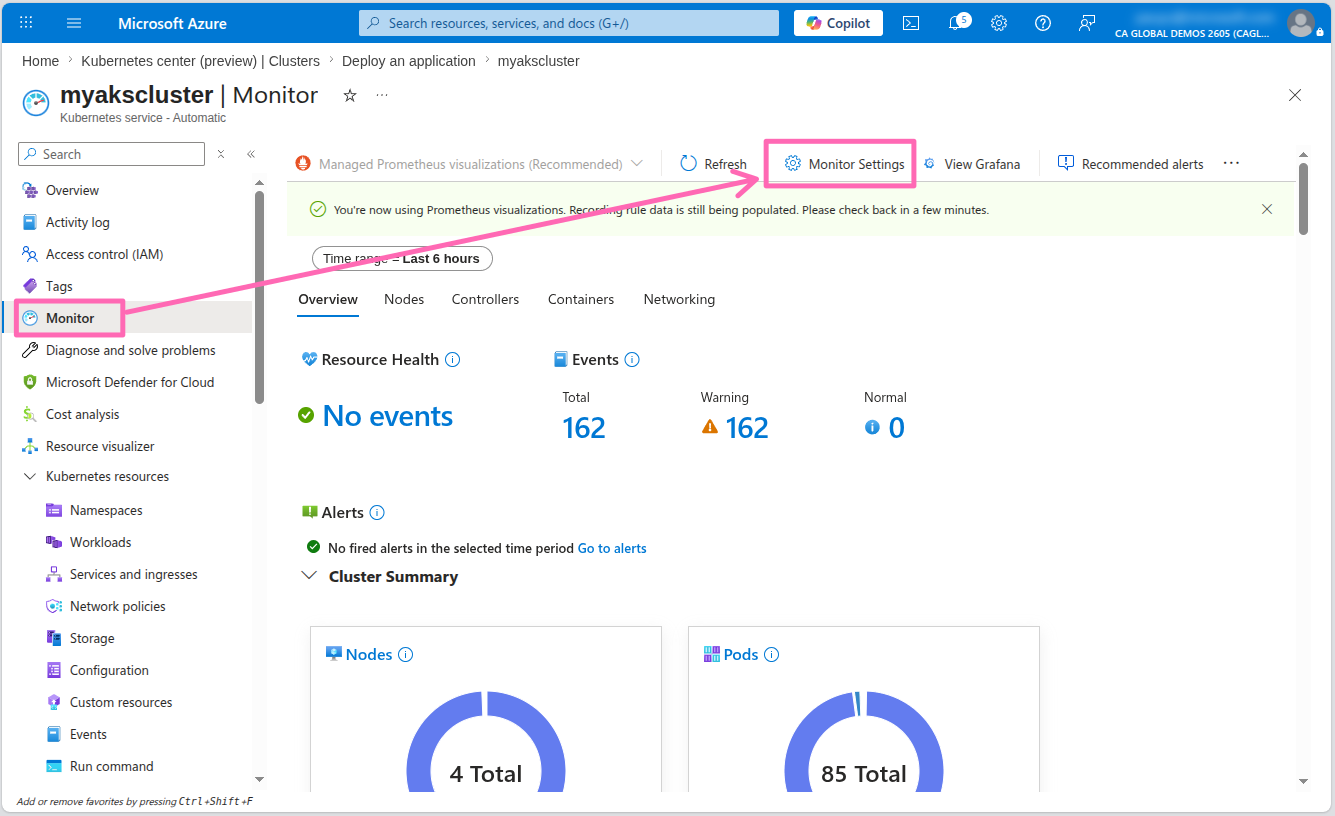
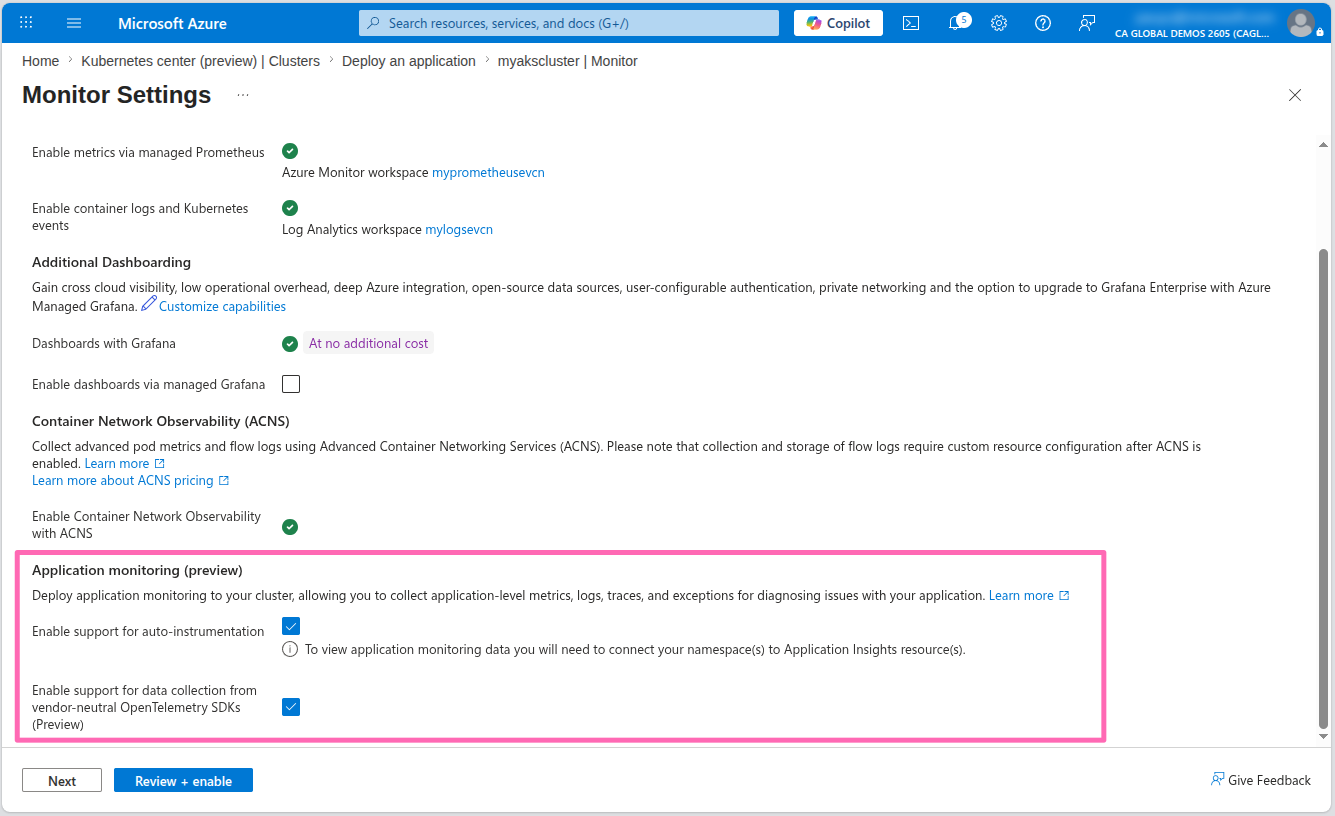
To enable the app monitoring feature on your AKS cluster navigate to the Monitor blade of your AKS cluster in the Azure portal then select Monitor Settings.
Scroll down to the Application monitoring (preview) section and select the Enable checkboxes for both auto-instrumentation and OpenTelemetry data collection, then select the Review + enable button.
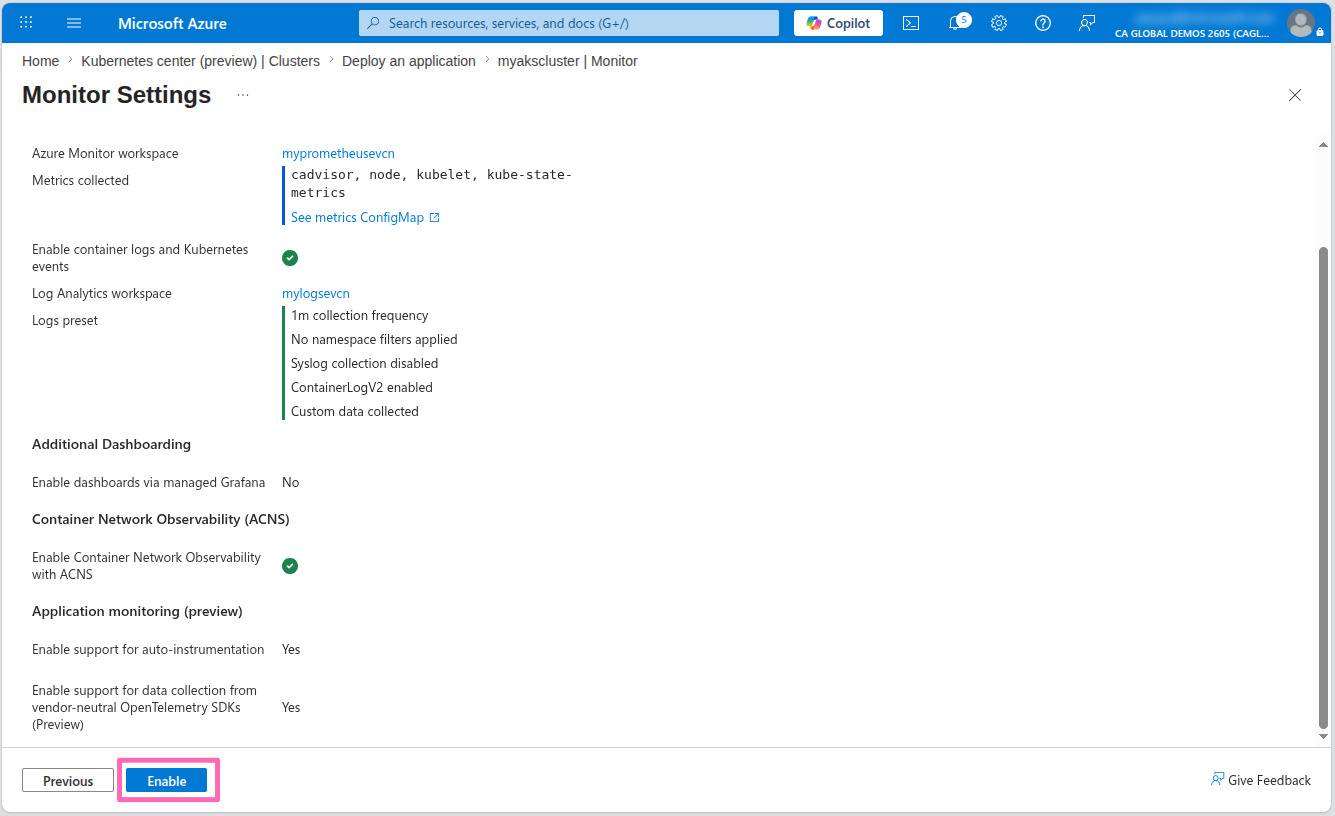
Review the changes and select the Enable button to enable the feature.
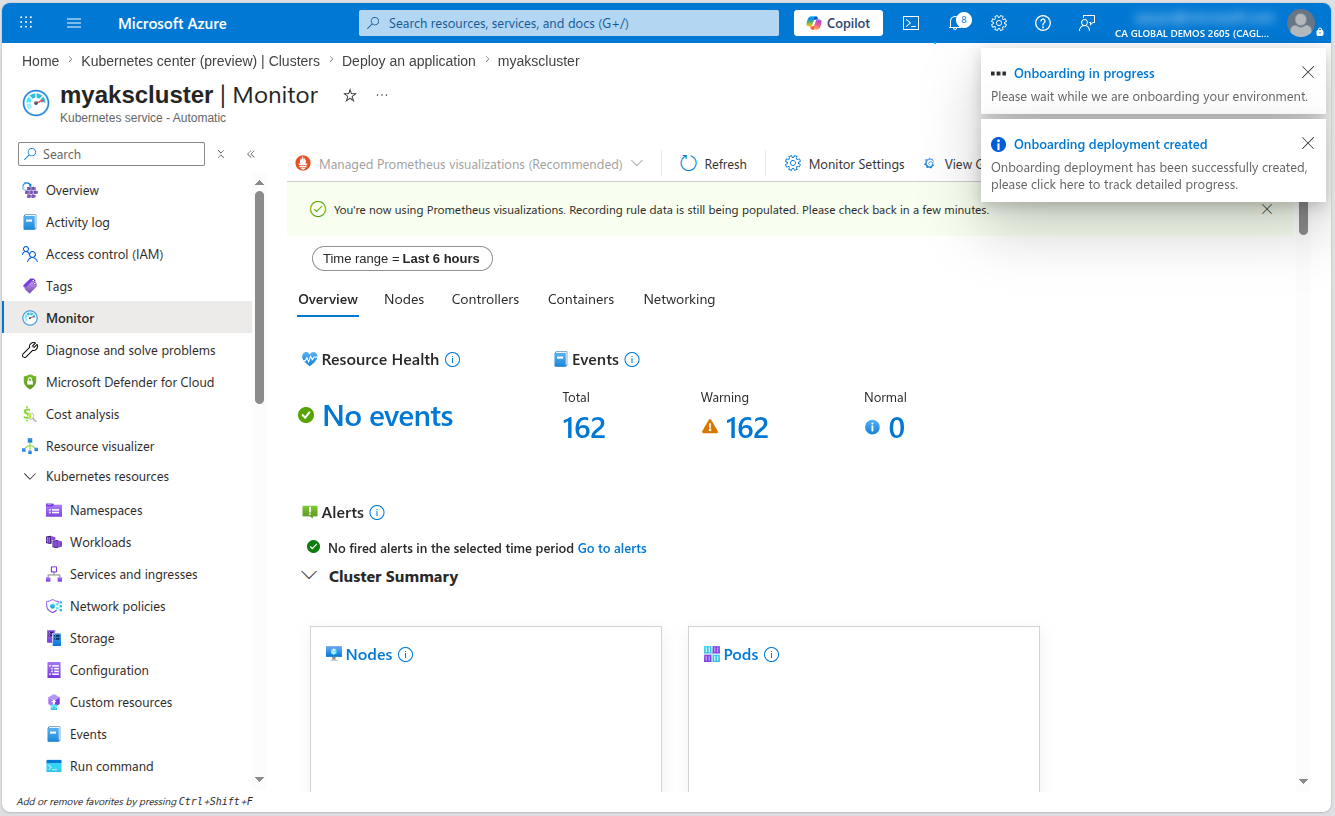
The onboarding process will take a few minutes to complete as the necessary components are being set up in your cluster. Wait for the process to complete before moving on to the next steps.
With this feature enabled, you can now deploy a new Instrumentation custom resource to your AKS cluster to automatically instrument your applications without any modifications to the code.
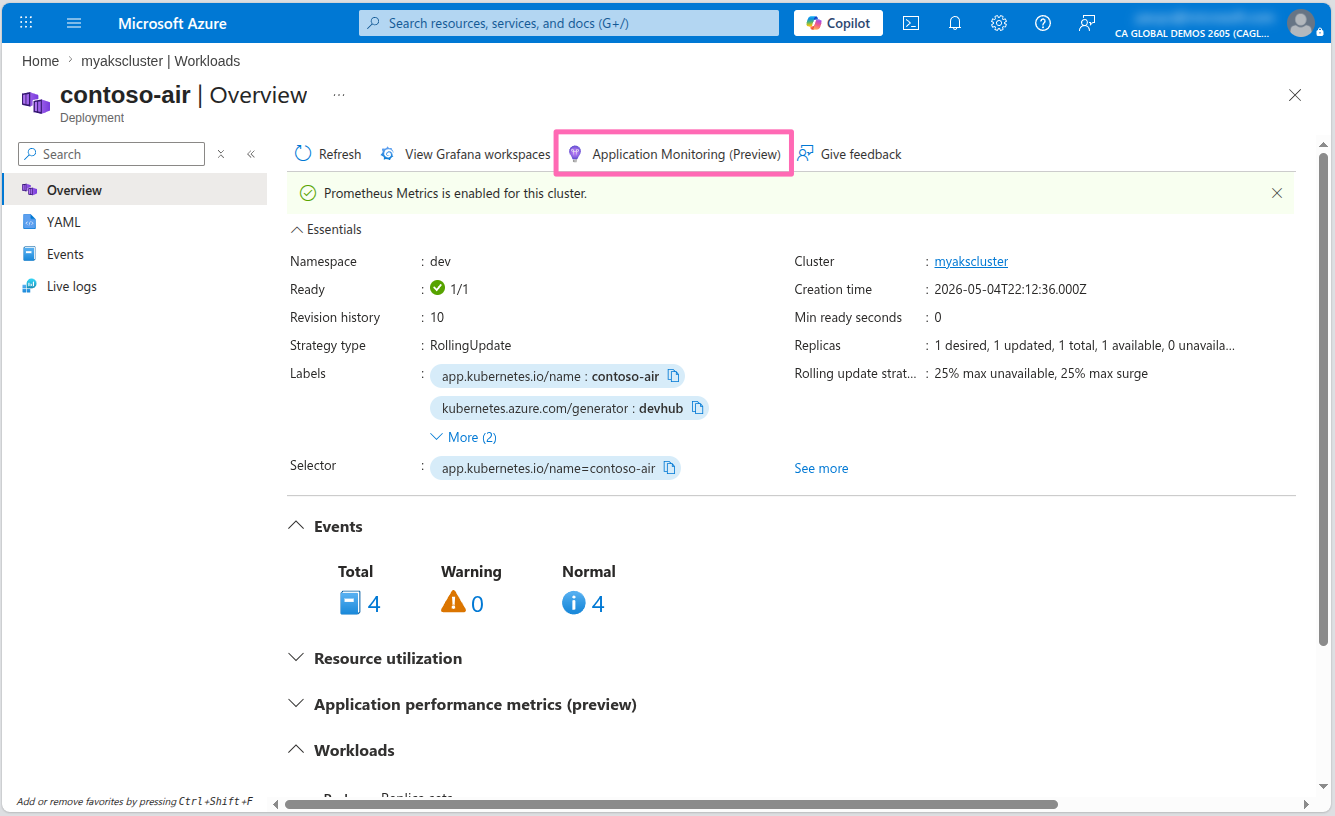
In the Azure portal, navigate to the Workloads section under Kubernetes resources in the menu. Filter by the dev namespace and select the contoso-air deployment to view the deployment details.
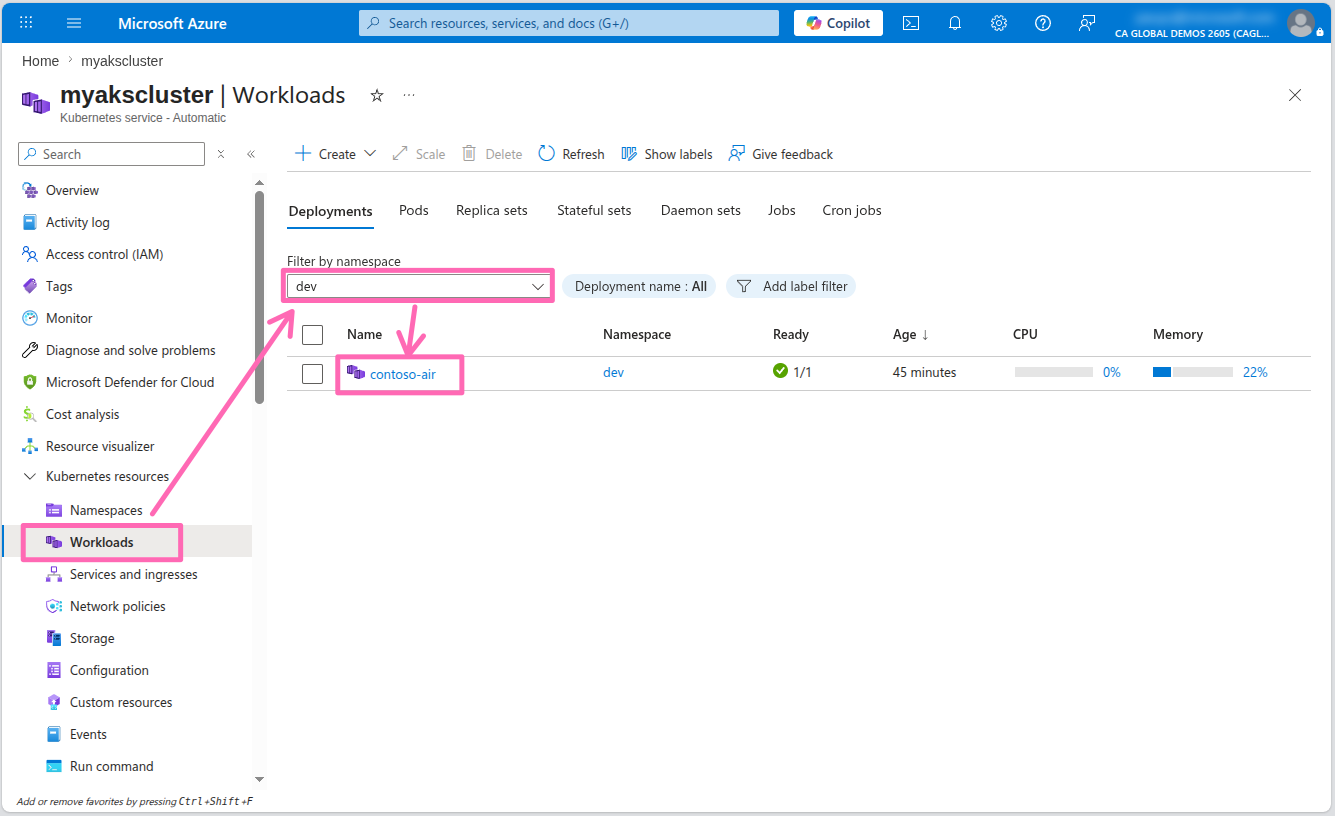
Select the Application Monitoring (Preview) tab to configure AutoInstrumentation for the contoso-air application.
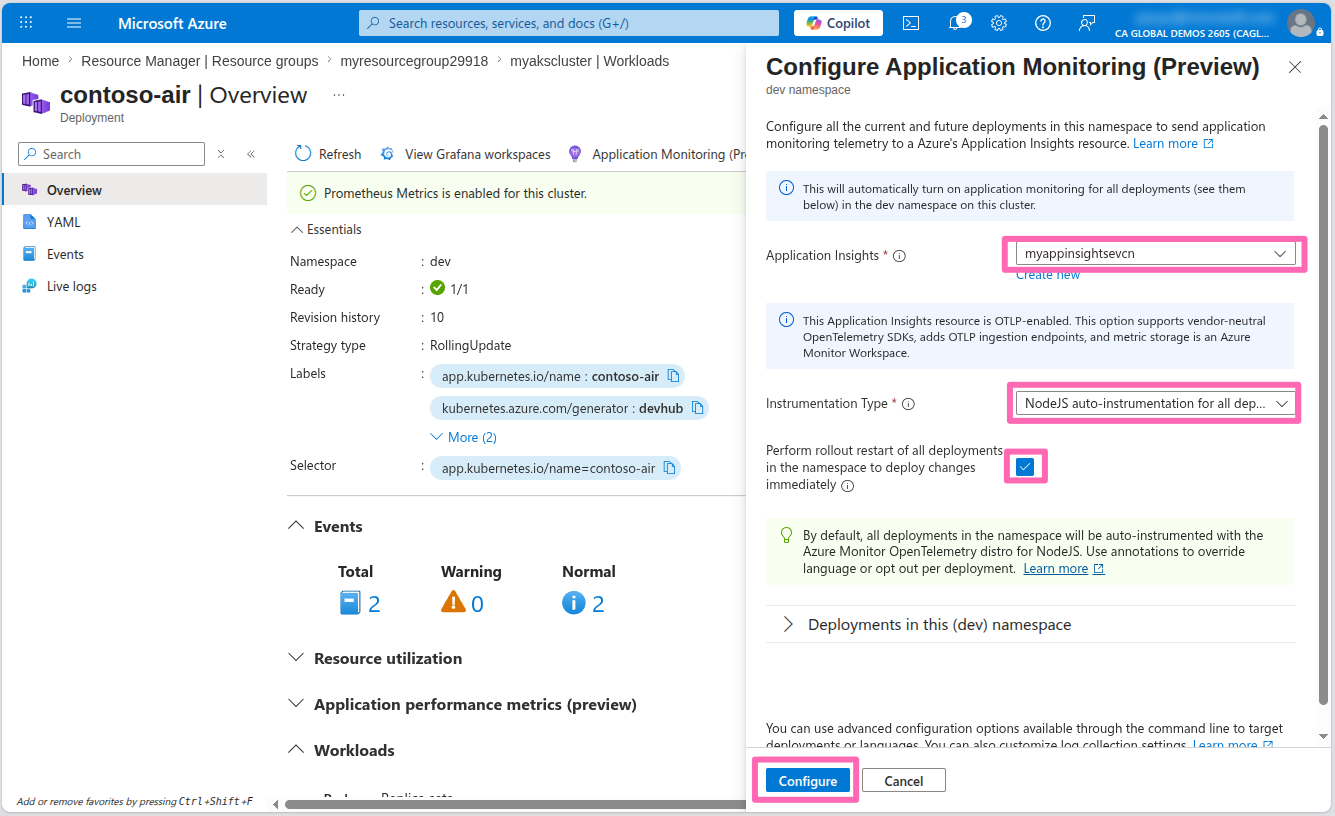
In the Configure Application Monitoring pane, enter the following details:
- Application Insights: Select the Application Insights resource in your resource group
- Application Language: Select NodeJS auto-instrumentation for all deployments
- Check the Perform rollout restart of all deployments in the namespace to deploy changes immediately checkbox.
- Select Configure to apply the changes.
This is a simple example of how to instrument your application across an entire namespace. You can also instrument individual deployments by deploying custom resources into your Kubernetes cluster. See the documentation for more details.
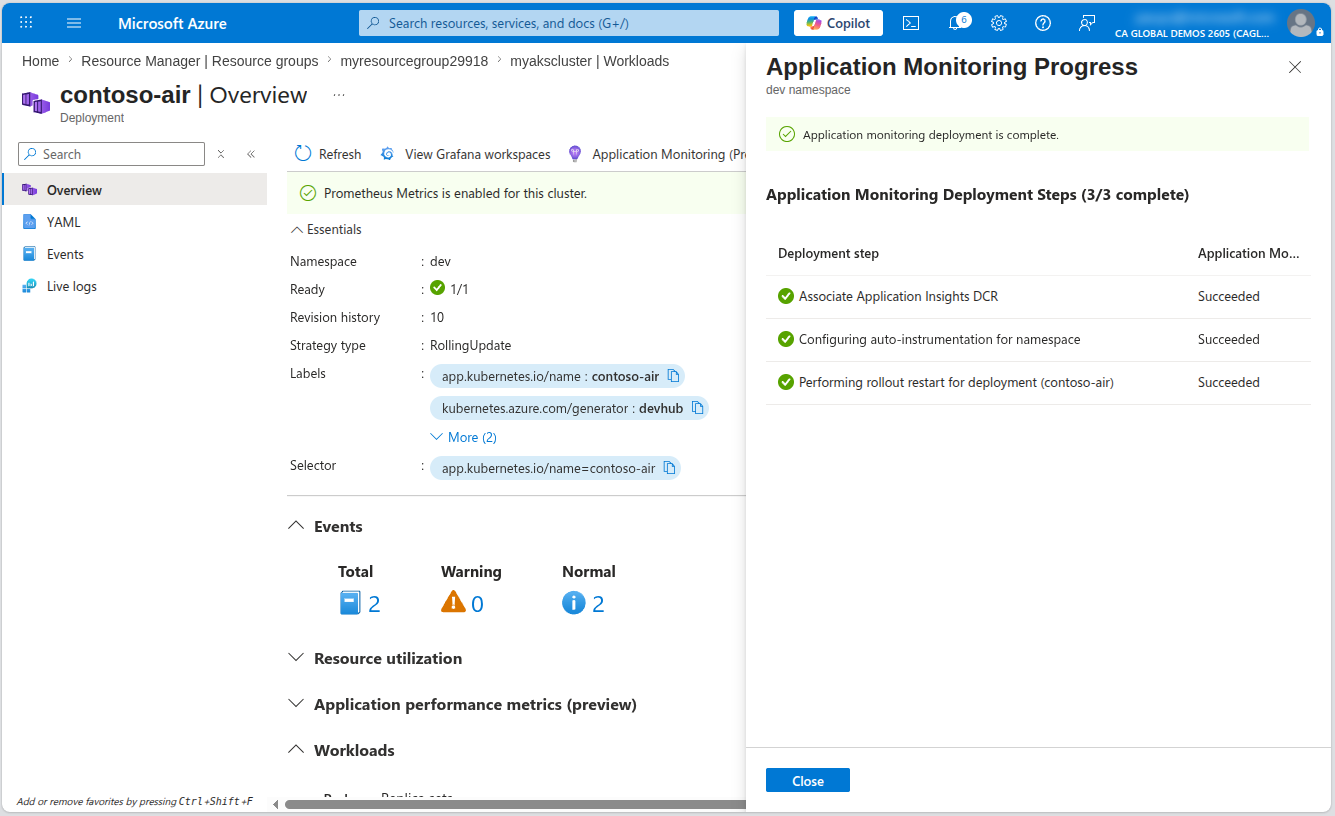
Once the configuration is applied, the contoso-air deployment will be restarted to apply the instrumentation changes immediately.
Now that the application is instrumented with Application Insights, navigate back to the contoso-air application in your web browser and chat with the AI assistant to generate some metrics. Once the metrics have been generated and collected by the OTel collector, you can view the application performance and usage metrics in the Azure portal.
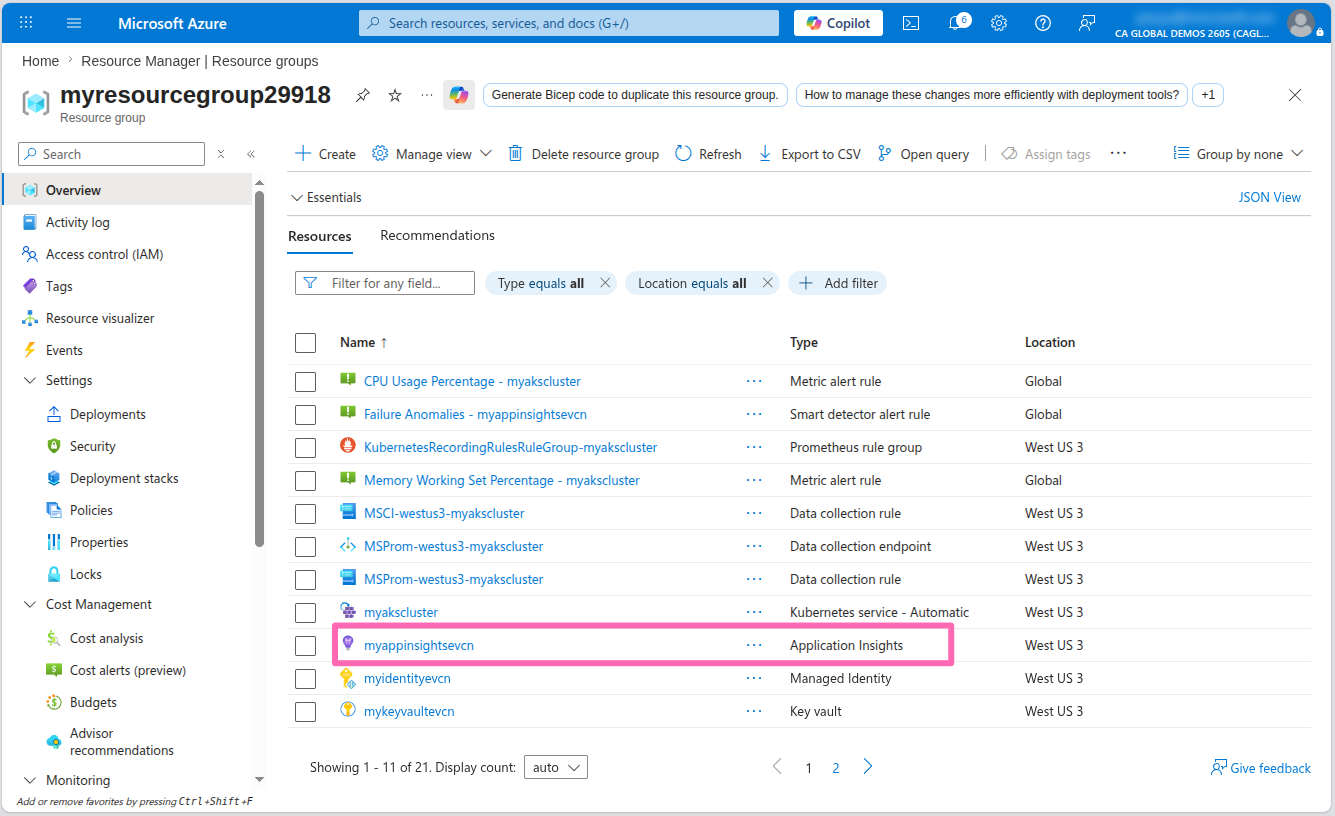
Navigate to the Application Insights resource in your resource group.
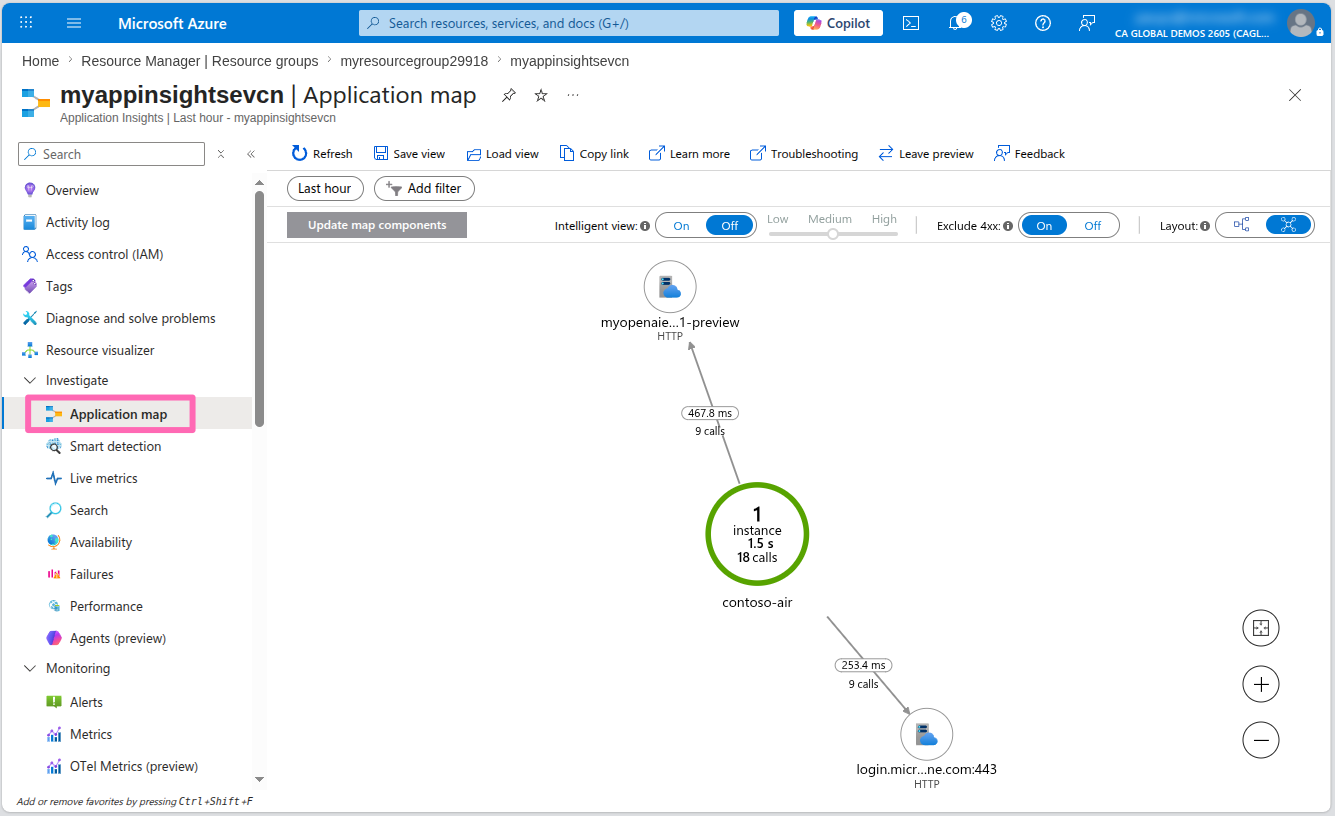
Select the Application map under Investigate in the menu to view a high-level overview of the application components, their dependencies, and number of calls.
If the Azure OpenAI endpoint does not appear in the application map, return to the Contoso Air website and chat with the AI assistant a bit more to generate some data. Then, in the Application Map, select the Refresh button. The map will update in real time and should now display the application connected to the Azure OpenAI endpoint, along with the request latency to the model endpoint.
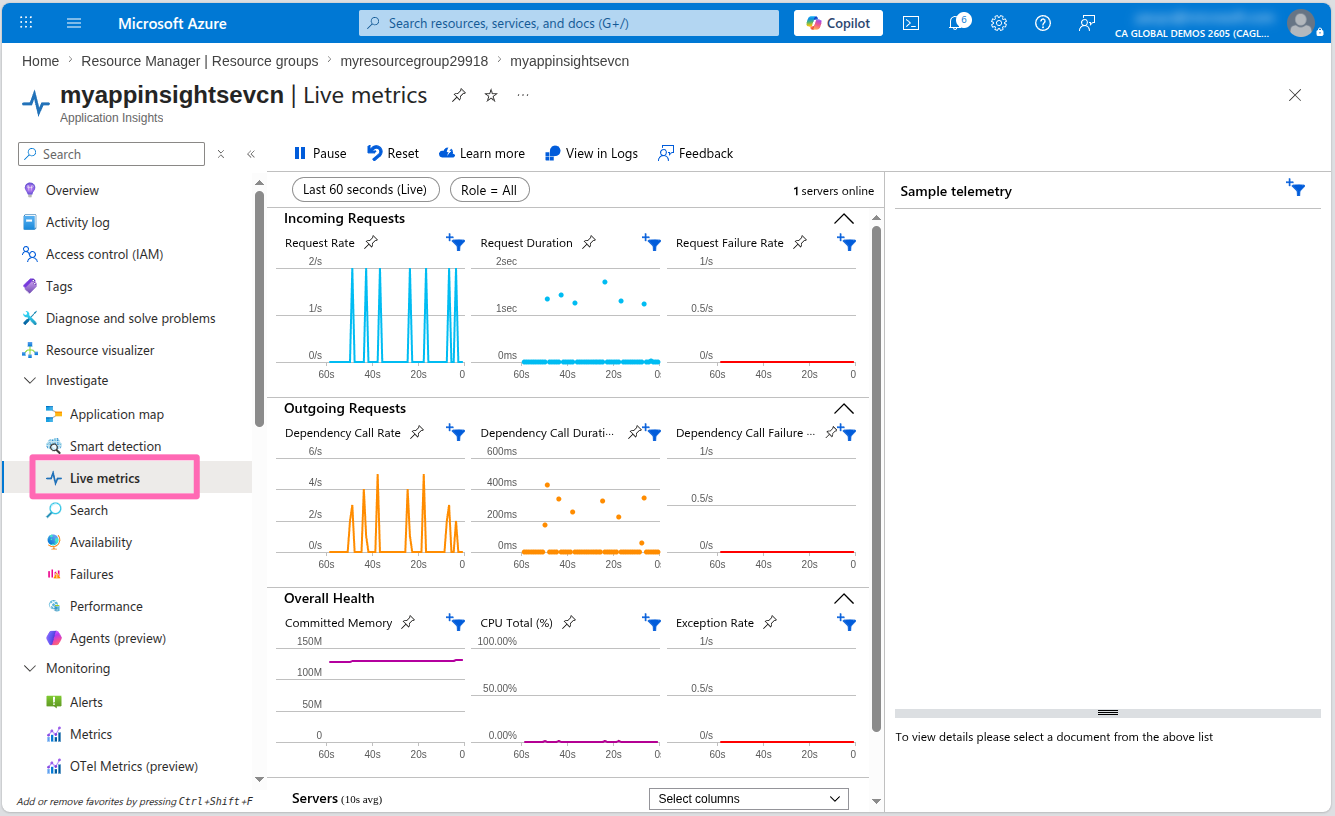
Select the Live Metrics tab to view the live metrics for the application. Here you can see incoming and outgoing requests, response times, and exceptions in real-time.
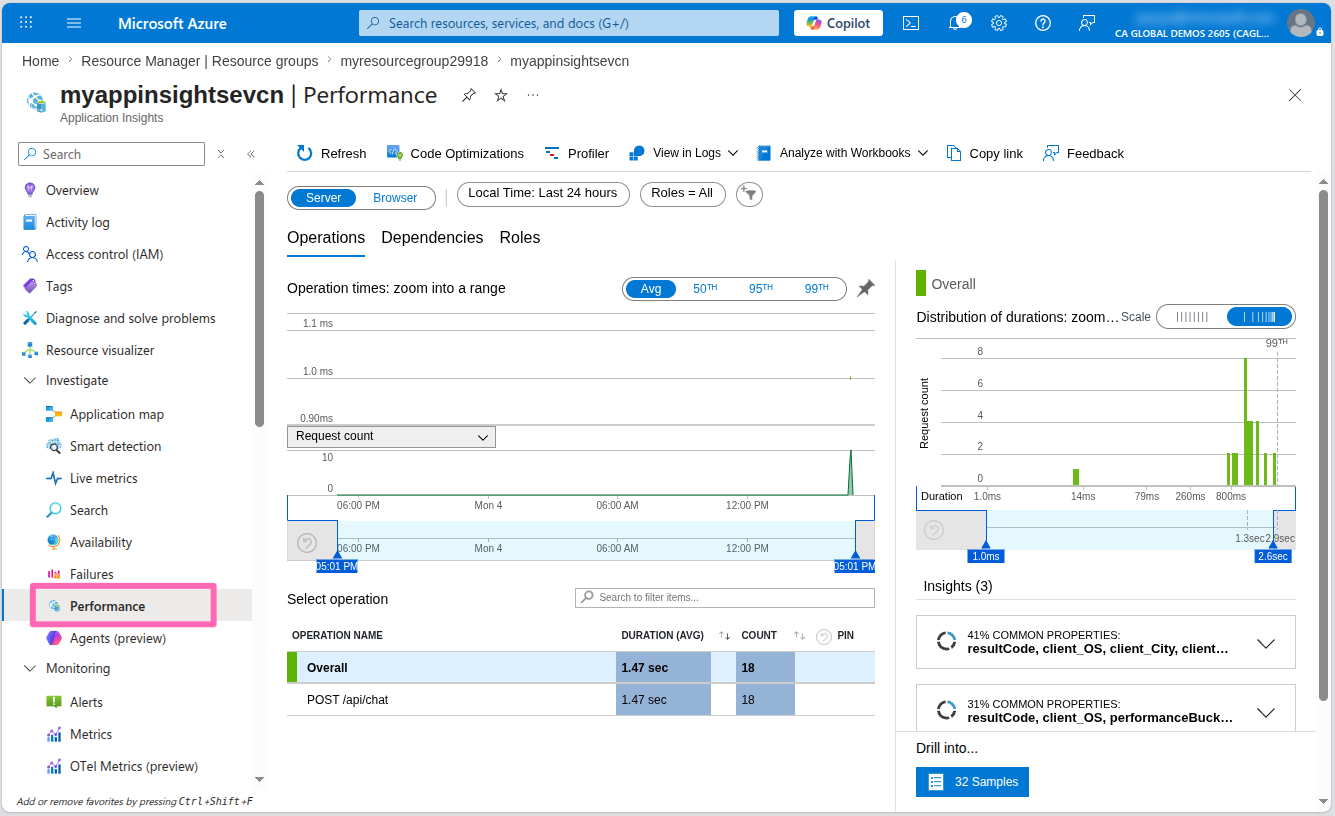
Finally, select the Performance tab to view the performance metrics for the application. Here you can see the average response time, request rate, and failure rate for the application.
Feel free to explore the other features of Application Insights and see how you can use it to monitor and observe your applications.
Cluster monitoring
AKS Automatic simplifies monitoring your cluster using Container Insights. It gathers and analyzes logs, metrics, and events from your cluster and applications, providing valuable insights into their performance and health.
To access this feature, navigate back to your AKS cluster in the Azure portal. You should see the Monitoring section in the menu. Select it to view a high-level summary of your cluster's performance.
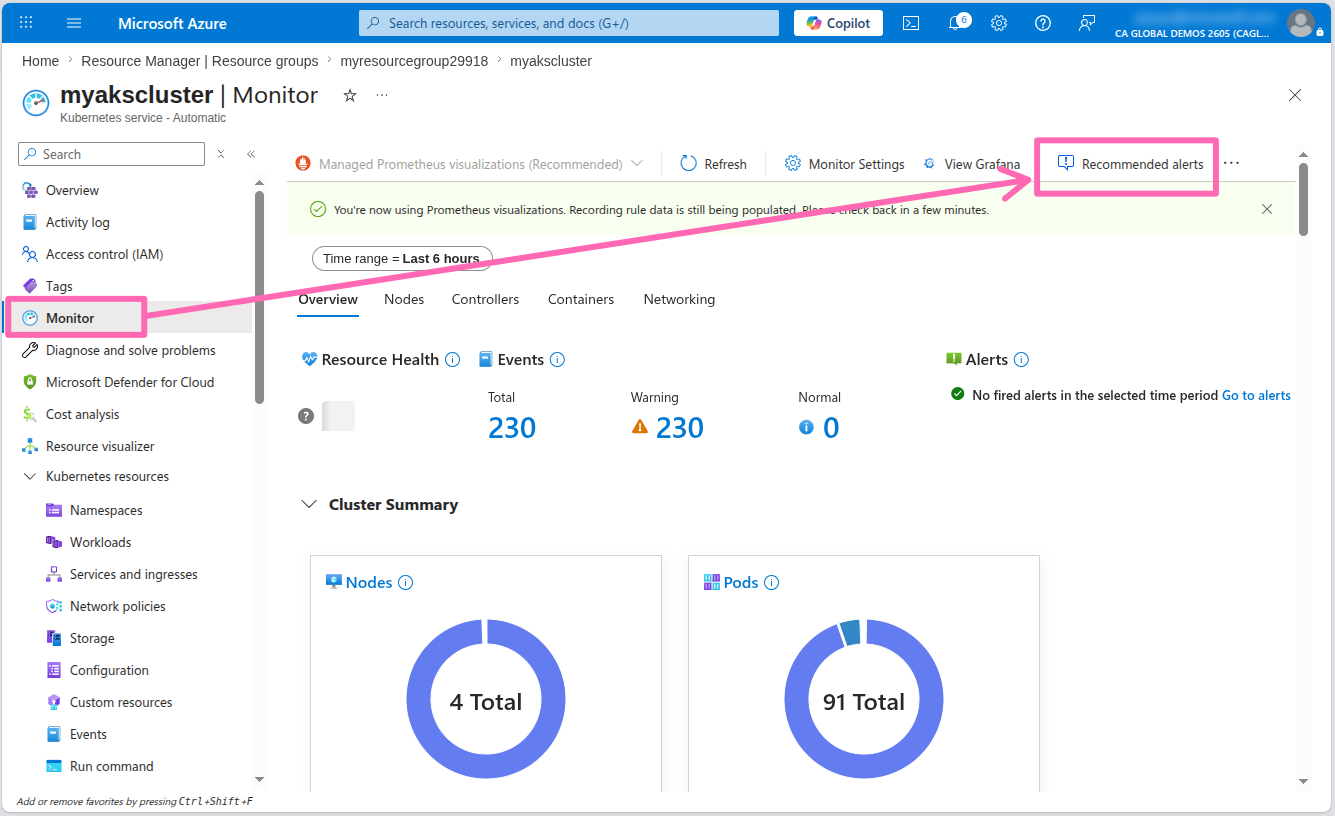
The AKS Automatic cluster was also pre-configured with basic CPU utilization and memory utilization alerts. You can also create additional alerts based on the metrics collected by the Prometheus workspace.
Select the Recommended alerts (Preview) button to view the recommended alerts for the cluster. Expand the Prometheus community alert rules (Preview) section to see the list of Prometheus alert rules that are available. You can enable any of these alerts by selecting the toggle switch.
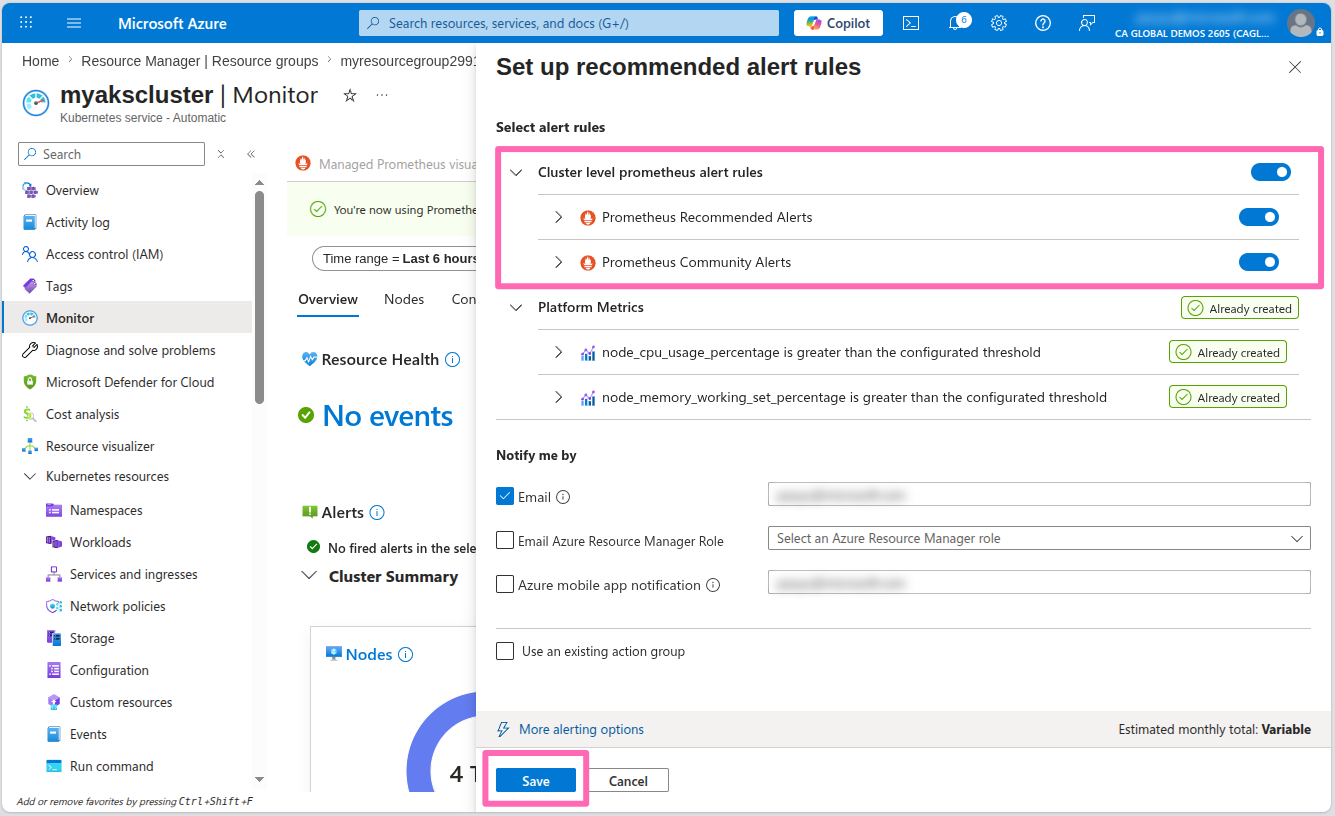
Select Save to enable the alerts.
Workbooks and logs
With Container Insights enabled, you can query logs using Kusto Query Language (KQL) and create custom or pre-configured workbooks for data visualization.
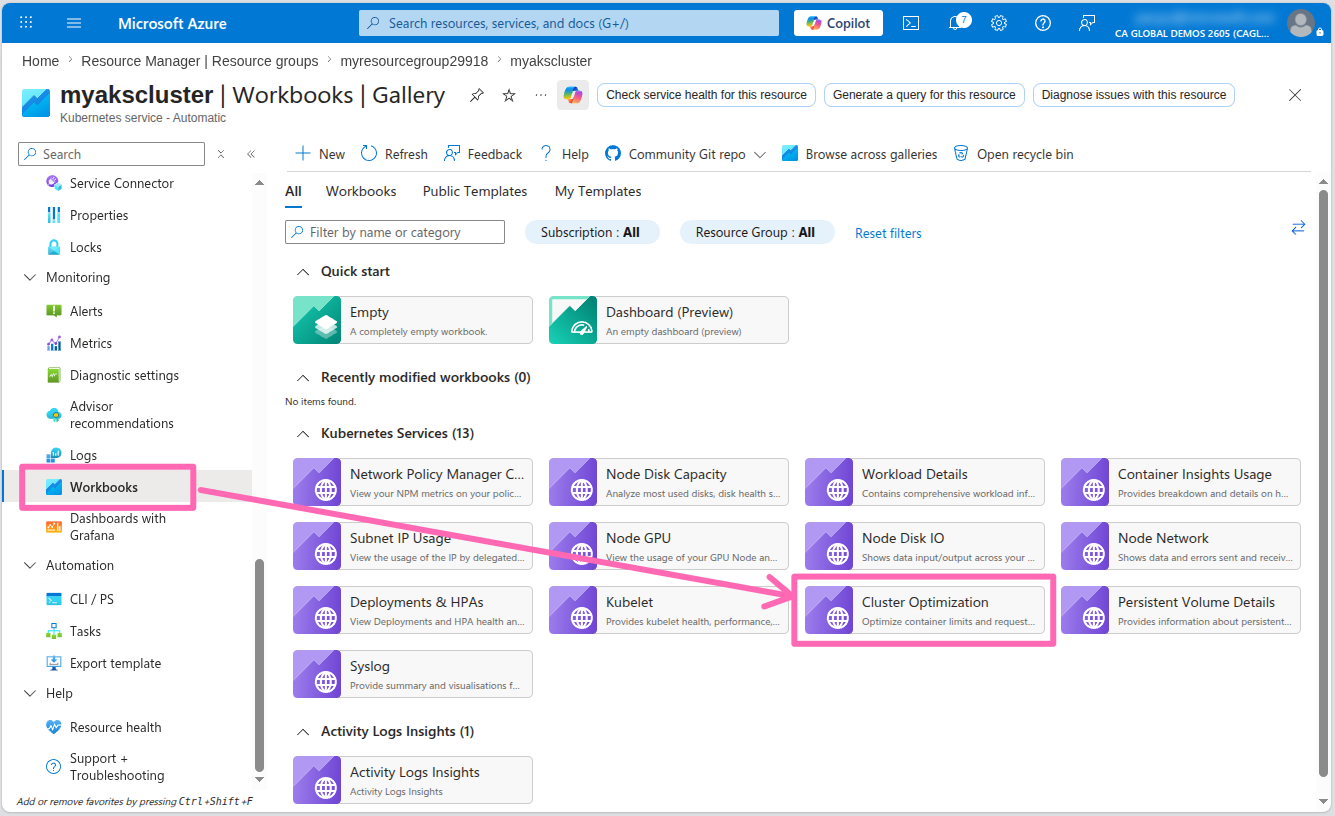
In the Monitoring section of the AKS cluster menu, select Workbooks to access pre-configured options. The Cluster Optimization workbook is particularly useful for identifying anomalies, detecting probe failures, and optimizing container resource requests and limits. Explore this and other available workbooks to monitor your cluster effectively.
The workbook visuals will include a query button that you can select to view the KQL query that powers the visual. This is a great way to learn how to write your own queries.
To aid in troubleshooting your application, select Logs from the Monitoring section in the AKS cluster menu. This section provides access to the logs gathered by the Azure Monitor agent operating on the cluster nodes.
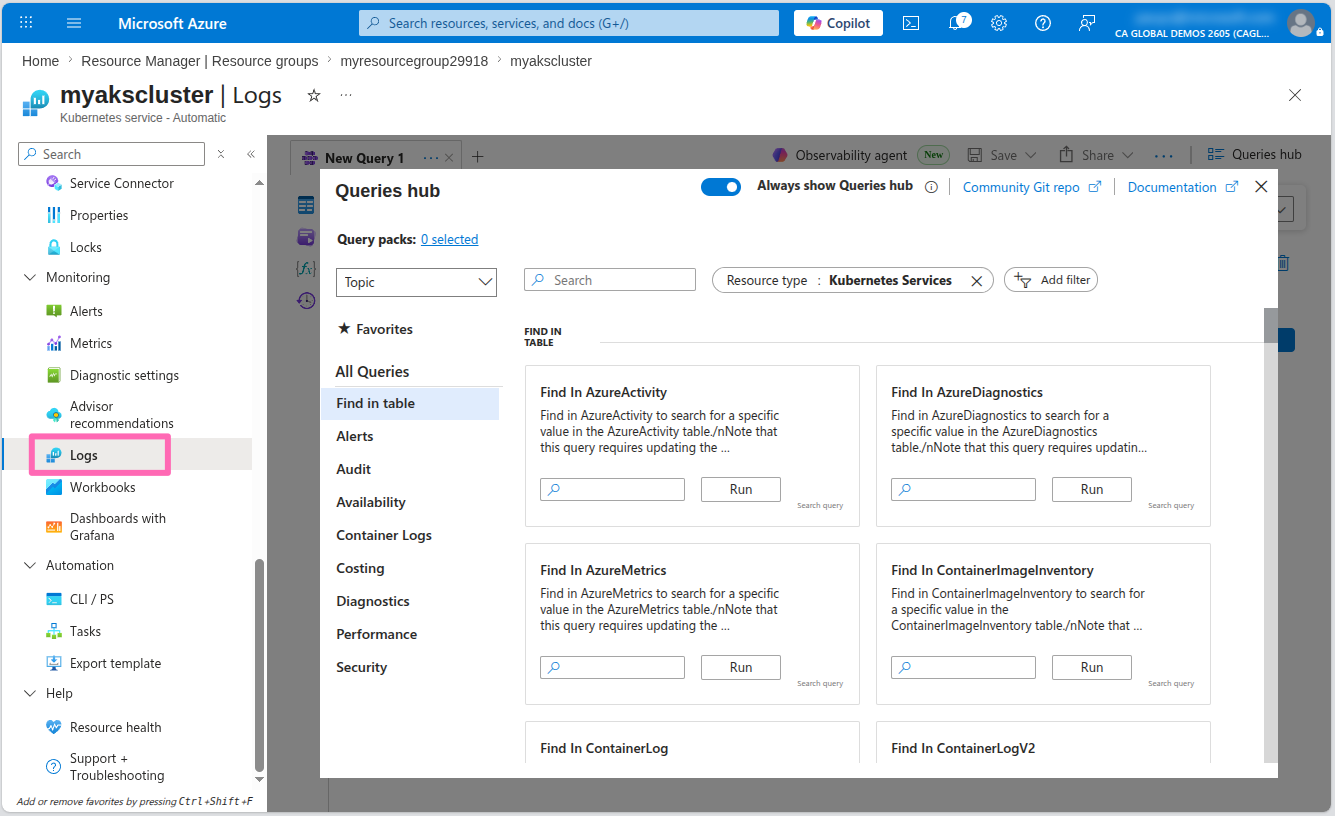
If you are presented with a Welcome to Log Analytics pop-up, close it to access the query editor.
Close the Queries hub pop-up to get to the query editor, then change the query editor from Simple mode to KQL mode by using the drop-down menu in the top-right corner.
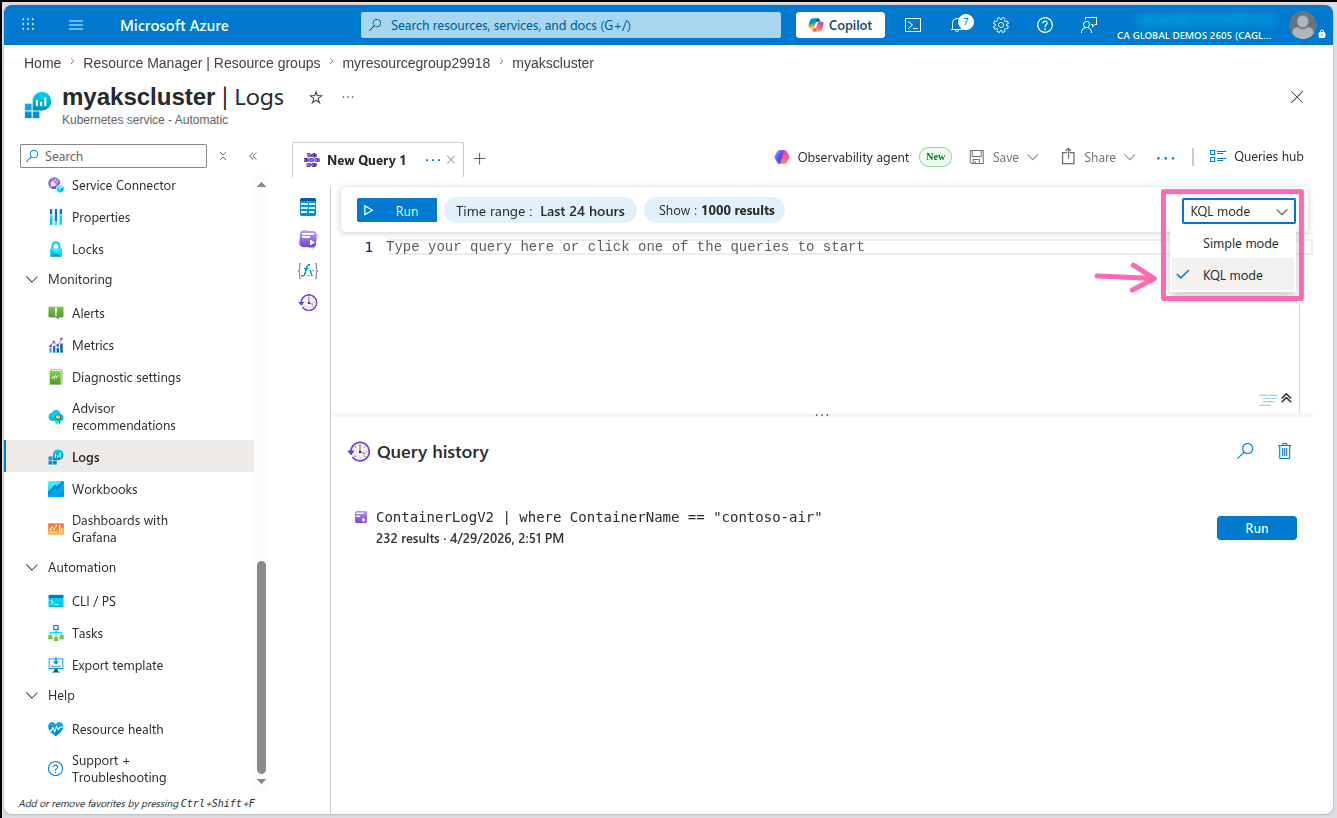
In the editor window, type the following query, then select the Run button to view container logs.
ContainerLogV2
| where ContainerName == "contoso-air"
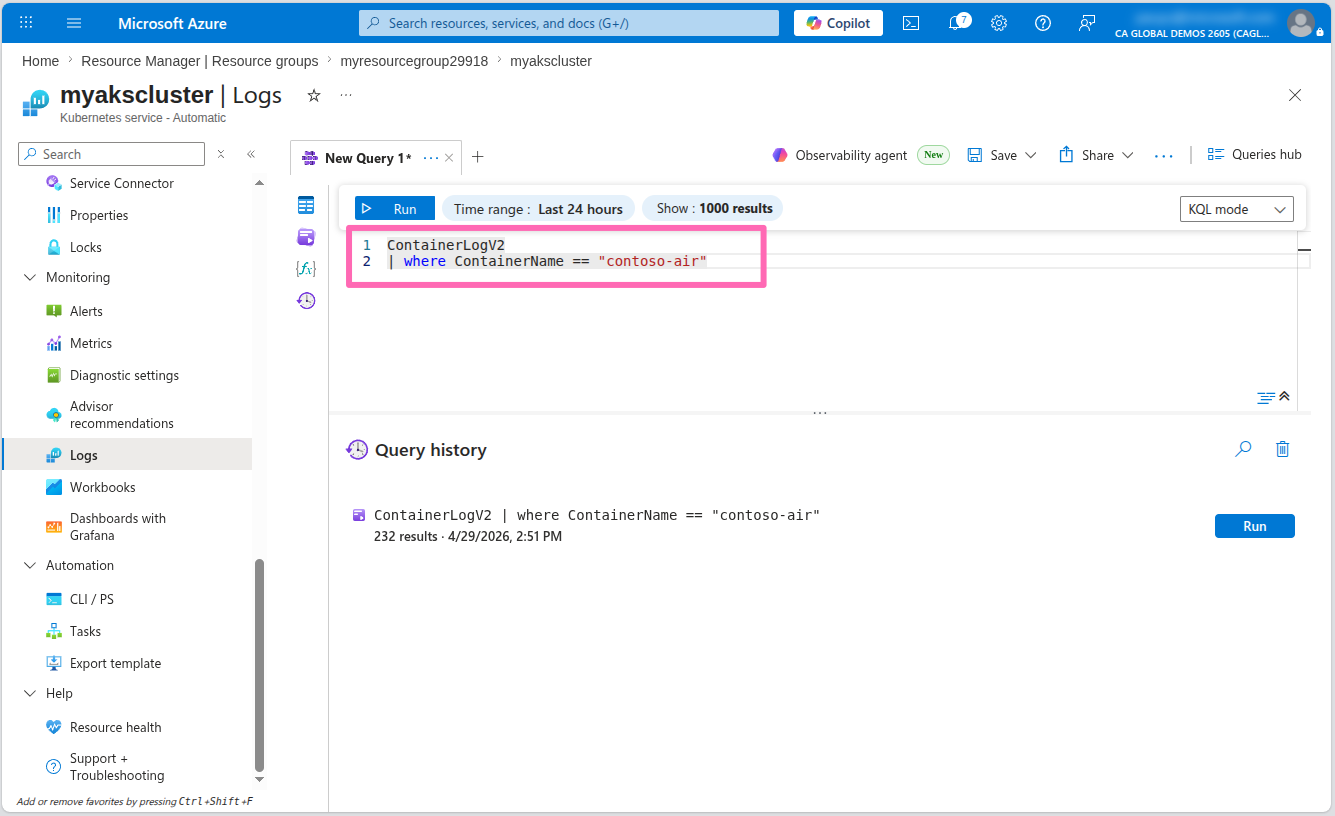
You should see some log messages in the table below. Expand some of the logs to view the message details that were generated by the application.
Some of the queries might not have enough data to return results.
Dashboards with Grafana
The Azure portal provides a great way to view metrics and logs, but if you prefer to visualize the data using Grafana, or execute complex queries using PromQL, you can use the Dashboards with Grafana feature built into AKS.
Dashboards with Grafana is a free Grafana experience integrated directly into the AKS portal. It does not require a separate Azure Managed Grafana resource. This built-in feature gives you access to pre-configured dashboards and PromQL queries for your cluster metrics without any additional cost or setup.
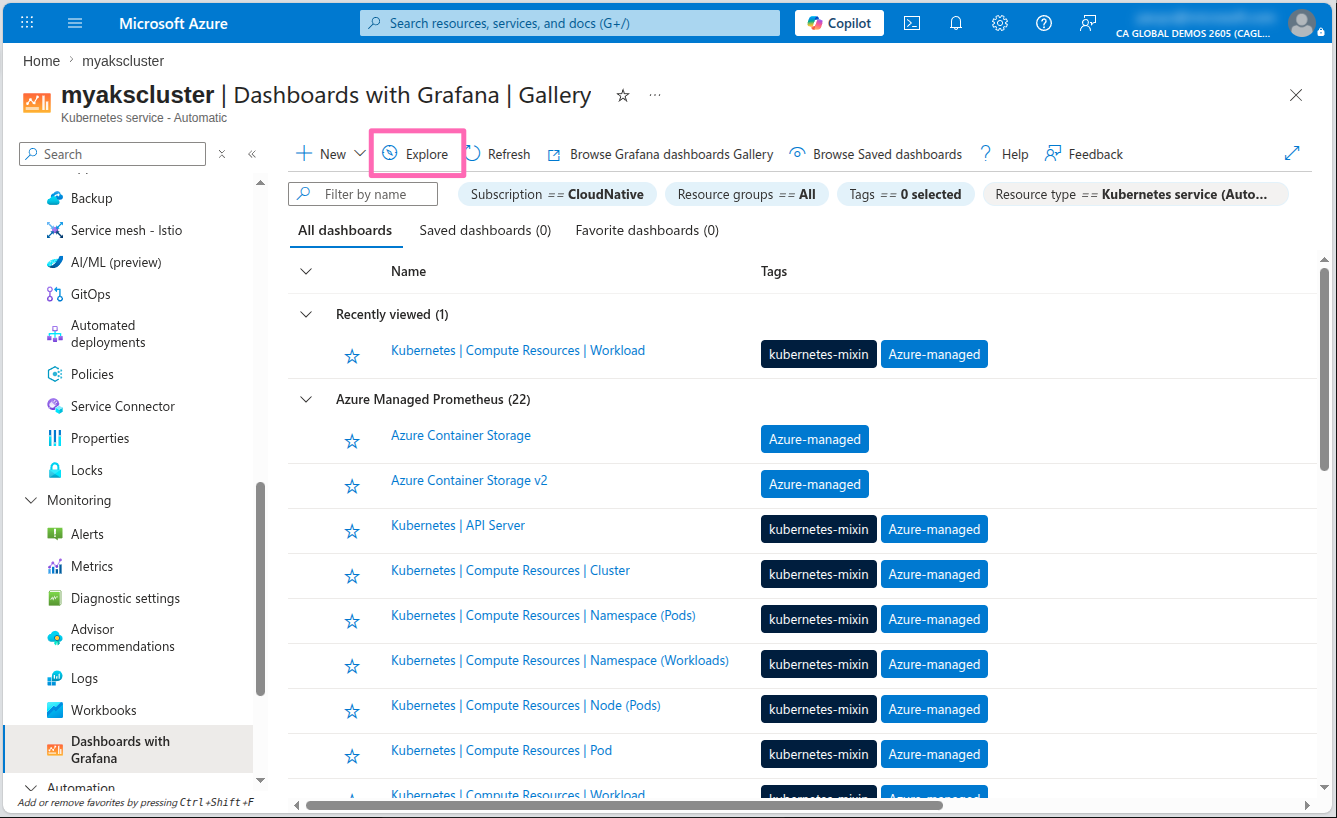
In the AKS cluster's menu, select Dashboards with Grafana under the Monitoring section. You'll see a list of all the pre-configured Grafana dashboards available for your cluster.
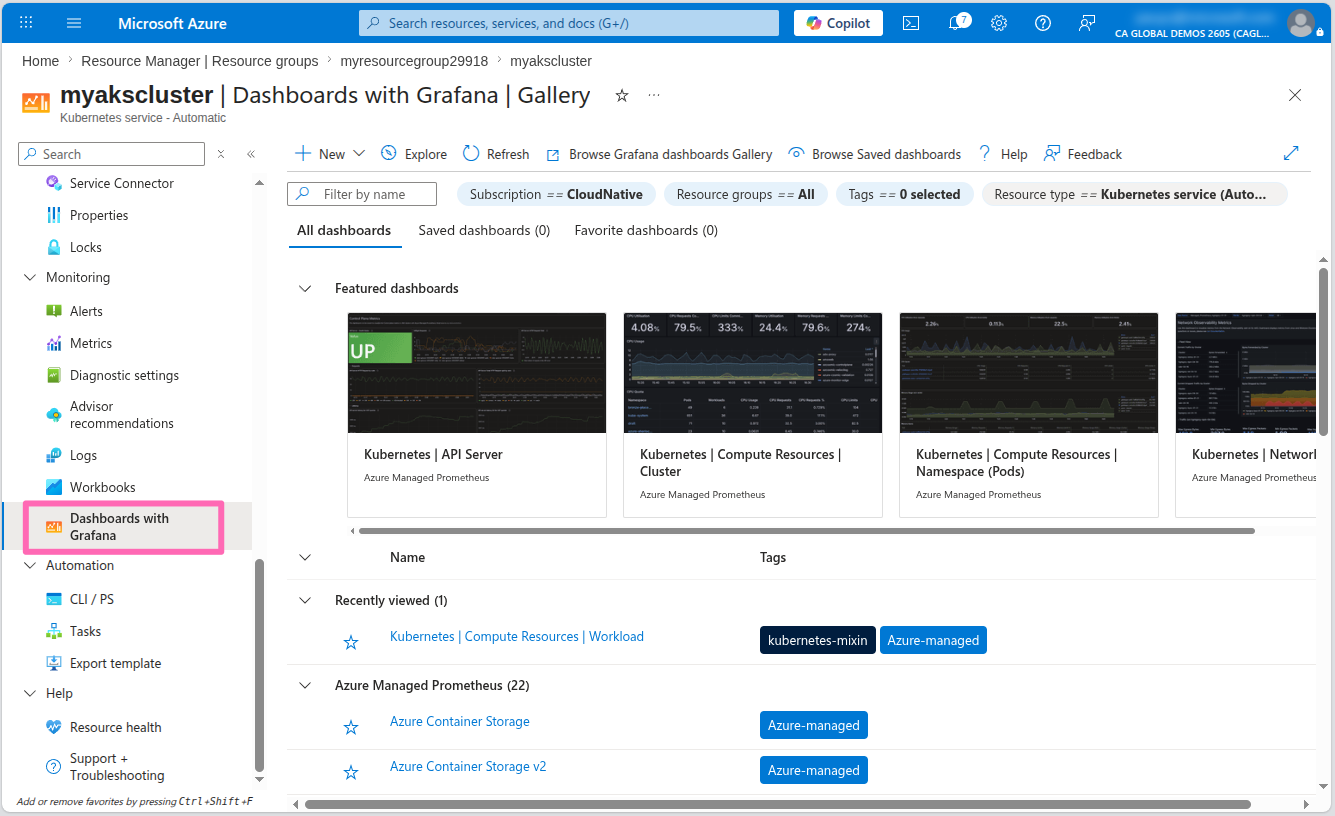
Sign in to the Grafana instance, then in the Grafana home page, select the Dashboards link in the menu. Here you'll see a list of pre-configured dashboards that you can use to visualize the metrics collected by the Prometheus workspace.
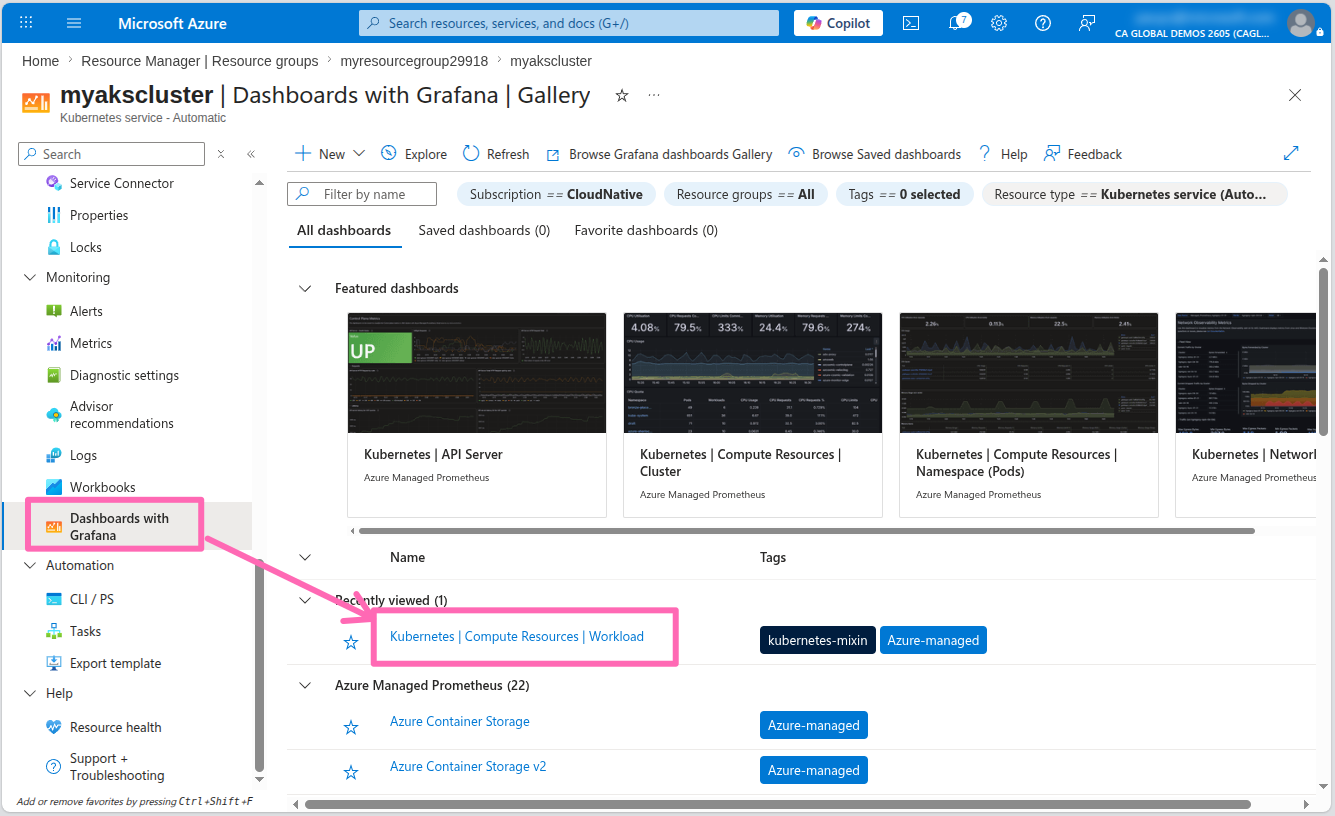
In the Dashboards list, expand the Azure Managed Prometheus folder and explore the dashboards available. Each dashboard provides a different view of the metrics collected by the Prometheus workspace with controls to allow you to filter the data.
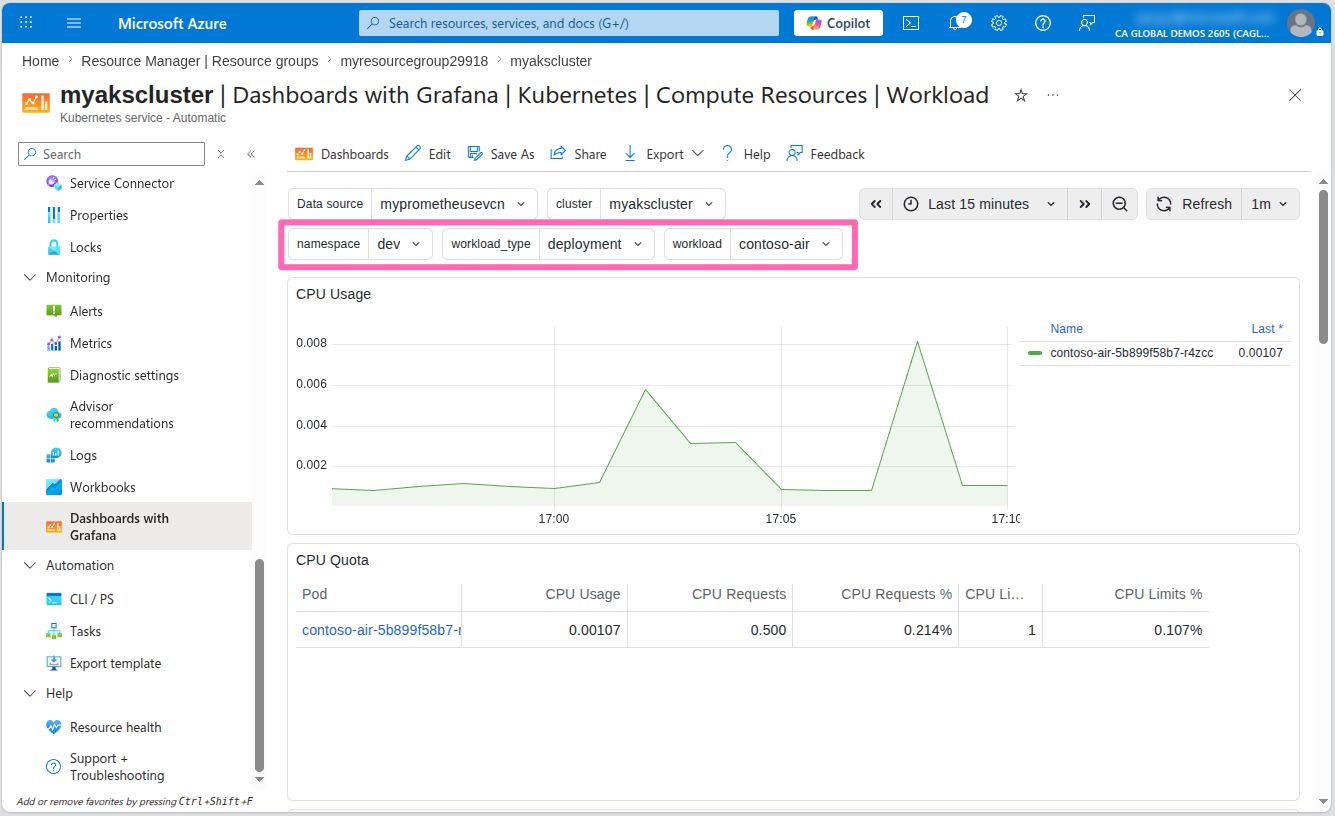
Select a Kubernetes / Compute Resources / Workload dashboard.
Filter the namespace to dev the type to deployment, and the workload to contoso-air. This will show you the metrics for the contoso-air deployment.
Querying metrics with PromQL
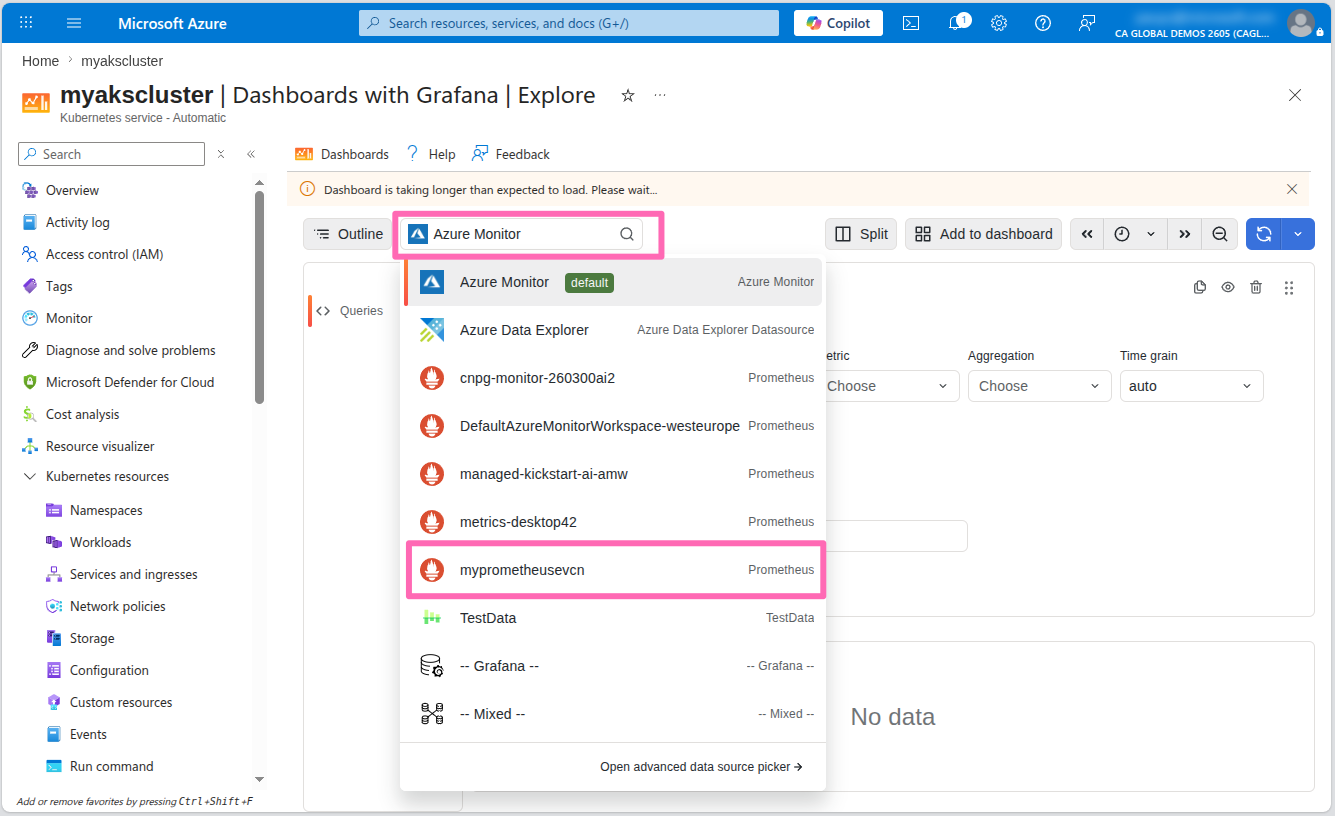
If you prefer to write your own queries to visualize the data, select Dashboards to navigate back to the dashboards list and select the Explore tab at the top of the pane.
In the Explore pane, Azure Monitor is the default datasource. You can change this by selecting it and selecting your Prometheus data source.
The query editor supports a graphical query builder and a text-based query editor. The graphical query builder is a great way to get started with PromQL. You can select the metric you want to query, the aggregation function, and any filters you want to apply.
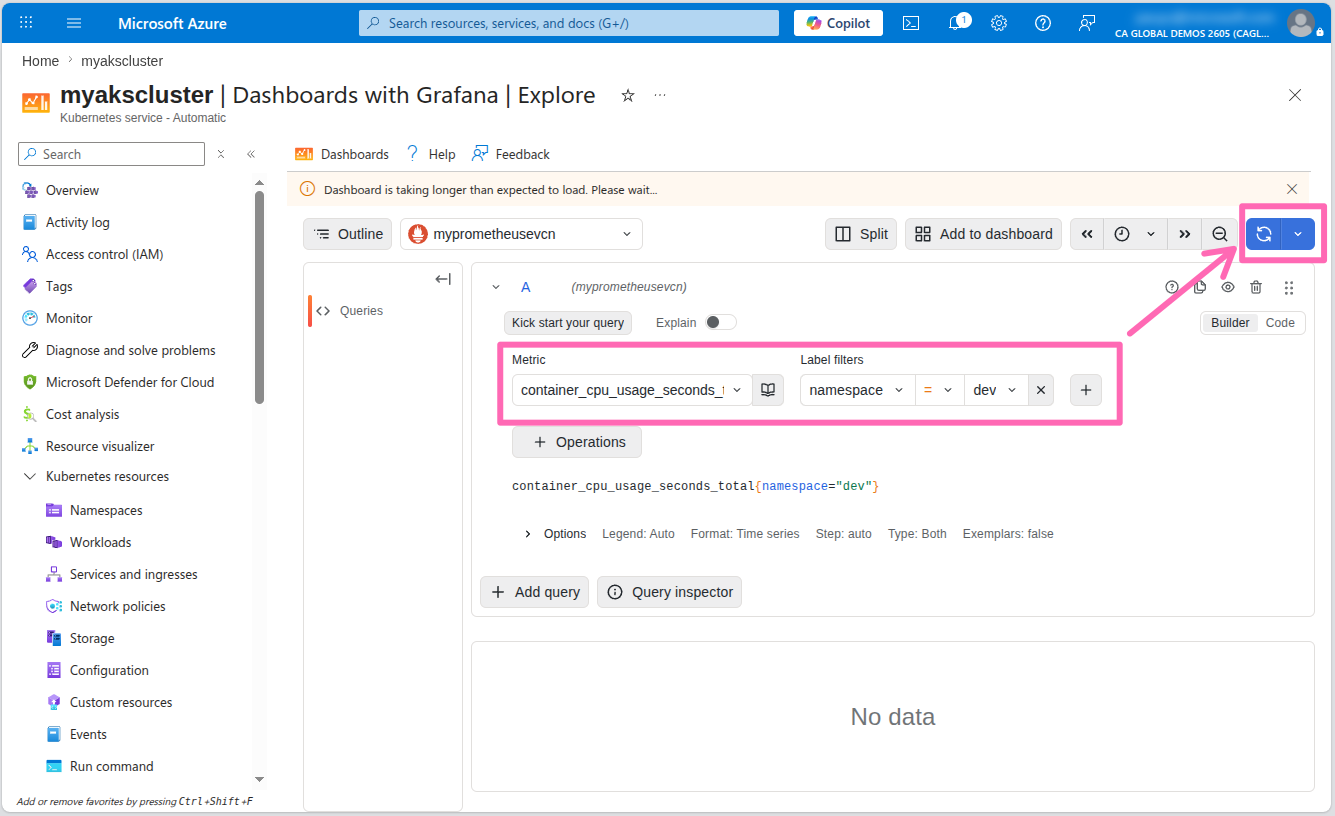
There is a lot you can do with Grafana and PromQL, so take some time to explore the features and visualize the metrics collected by the Prometheus workspace.
Scaling your cluster and apps
Now that you have learned how to deploy applications to AKS Automatic and monitor your cluster and applications, let's explore how to scale your cluster and applications to handle the demands of your workloads effectively.
Right now, the application is running a single pod. When the web app is under heavy load, it may not be able to handle the requests. To automatically scale your deployments, use Kubernetes Event-driven Autoscaling (KEDA). KEDA scales your application workloads based on utilization metrics, number of events in a queue, or a custom schedule using CRON expressions.
But simply implementing KEDA is not enough. KEDA can try to deploy more pods, but if the cluster is out of resources, the pods will not be scheduled and remain in pending status.
With AKS Automatic, Node Autoprovisioning (NAP) is enabled and replaces the traditional cluster autoscaler. NAP detects pods pending scheduling and automatically scales the node pool to meet demand. We won't go into the details of working with NAP in this workshop, but you can read more about it in the AKS documentation.
NAP will not only automatically scale out additional nodes to meet demand, it will also find the most efficient VM configuration to host the demands of your workloads and scale nodes in when the demand is low to save costs.
For the Kubernetes scheduler to efficiently place pods on nodes, it's best practice to include resource requests and limits in your pod configuration. Resource requests tell Kubernetes the minimum CPU and memory a container needs, while limits set the maximum it can use. These values help the scheduler find nodes with enough capacity.
The Automated Deployment setup added some default resource requests and limits to the pod configuration, but they may not be optimal. Knowing what to set these values to can be challenging. This is where the Vertical Pod Autoscaler (VPA) can help.
Vertical Pod Autoscaler (VPA) setup
VPA is a Kubernetes resource that automatically adjusts the CPU and memory requests and limits for your pods based on actual resource utilization. This helps optimize resource usage and reduce the risk of running out of resources.
AKS Automatic comes with the VPA controller pre-installed, so you can use the VPA resource immediately by simply deploying a VPA resource manifest to your cluster.
When you deployed the application using AKS Automated Deployments, the deployment manifest included some default resource requests and limits for the contoso-air application pods. These values may not be optimal for your workload, so using VPA can help you automatically adjust these values based on the actual resource utilization of the pods.
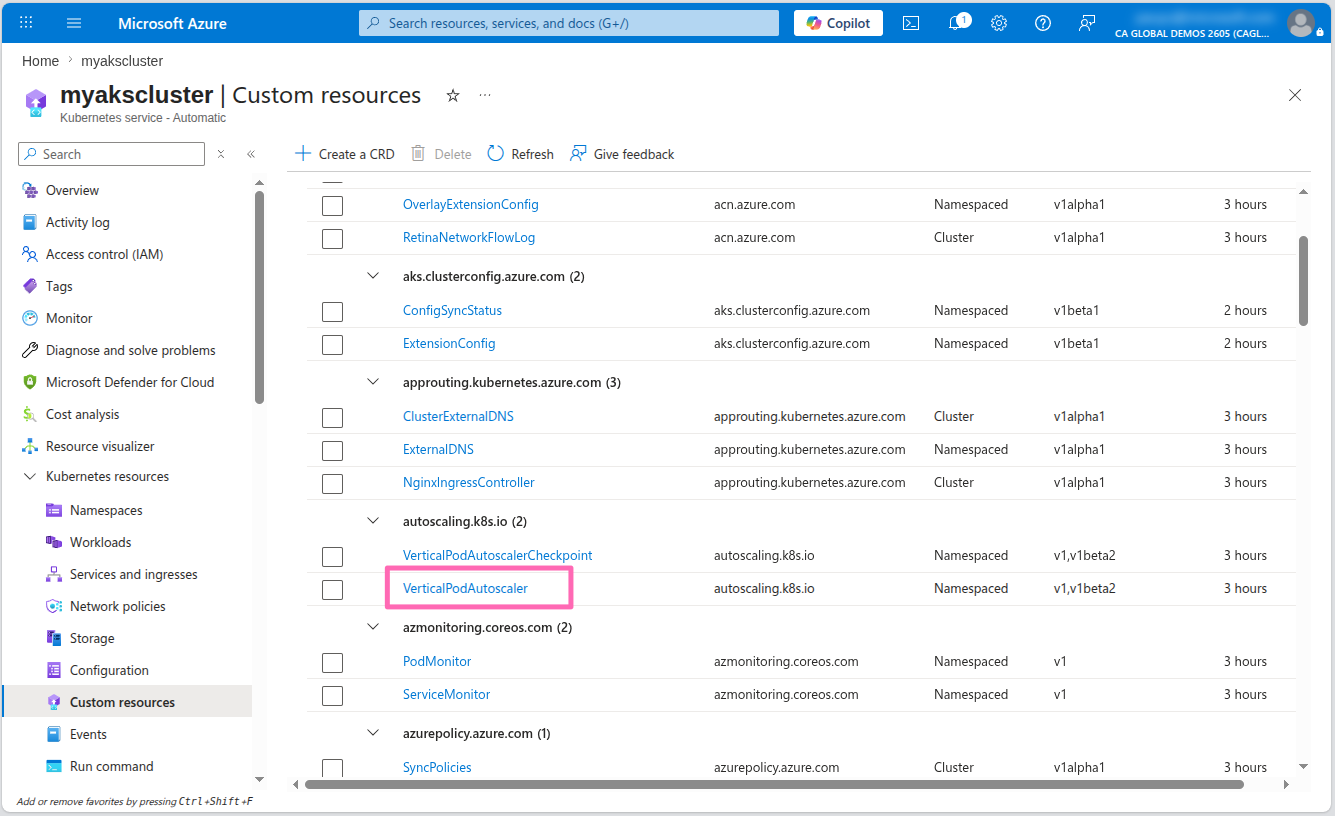
Navigate to the Custom resource section under Kubernetes resources in the AKS cluster menu. Scroll down to the bottom of the page and select the Load more button to view all the available custom resources.
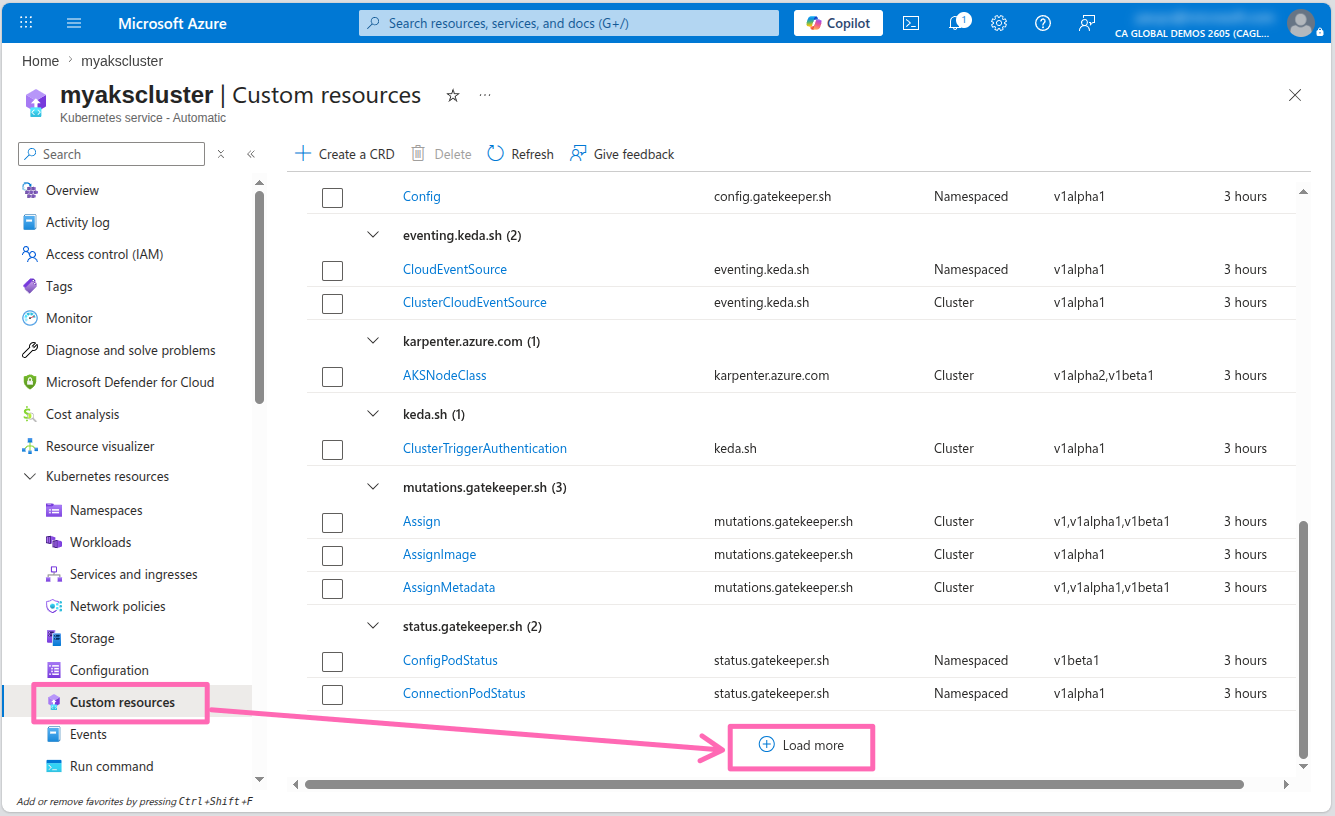
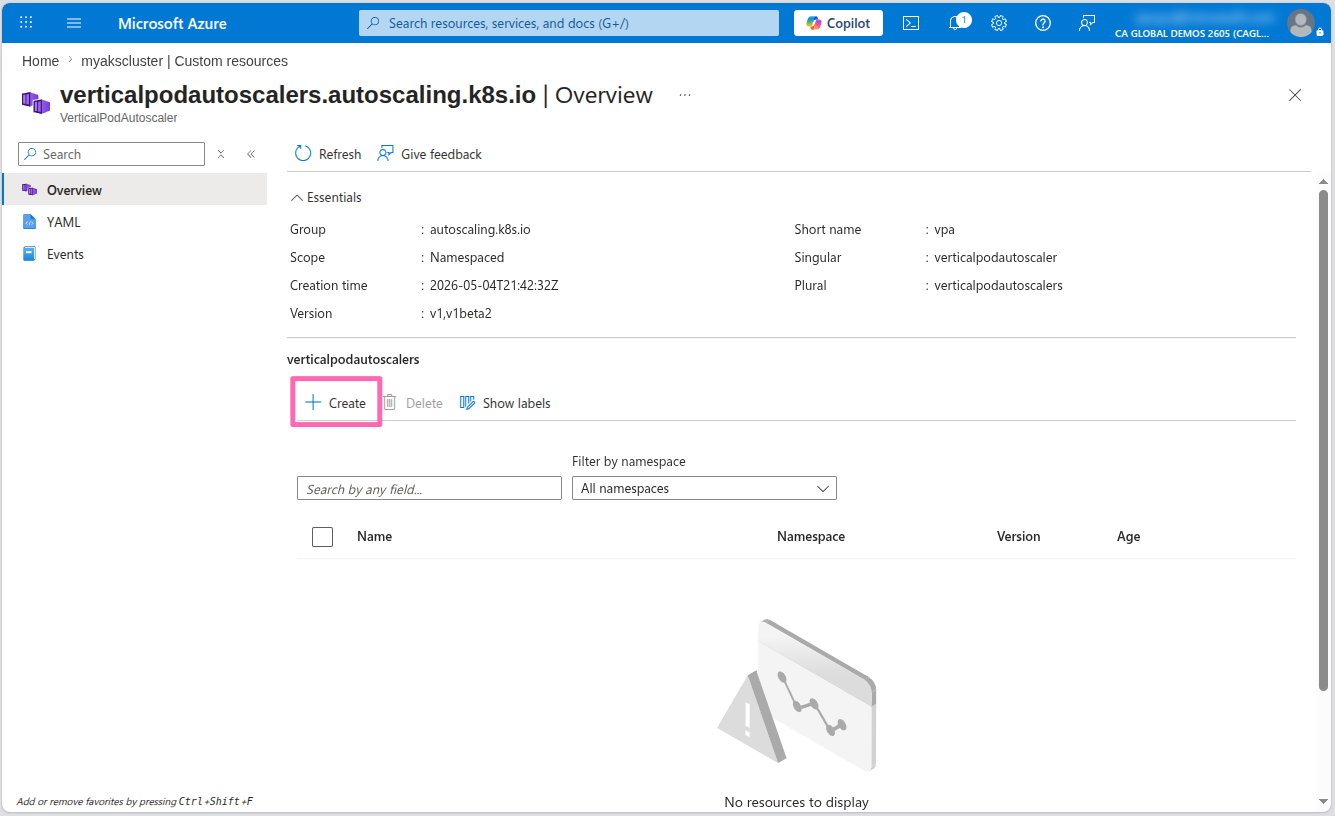
Select the VerticalPodAutoscaler resource to view the VPA resources in the cluster.
Select the + Create button where you'll see a Apply with YAML editor.
Not sure what to add here? No worries! You can lean on Microsoft Copilot in Azure to help generate the VPA manifest.
Select the text editor or use Alt + I to open the Copilot editor.
In the Draft with Copilot text box, type in the following prompt:
Help me create a vertical pod autoscaler manifest for the contoso-air deployment in the dev namespace and set min and max cpu and memory to something typical for a nodejs app. Please apply the values for both requests and limits.
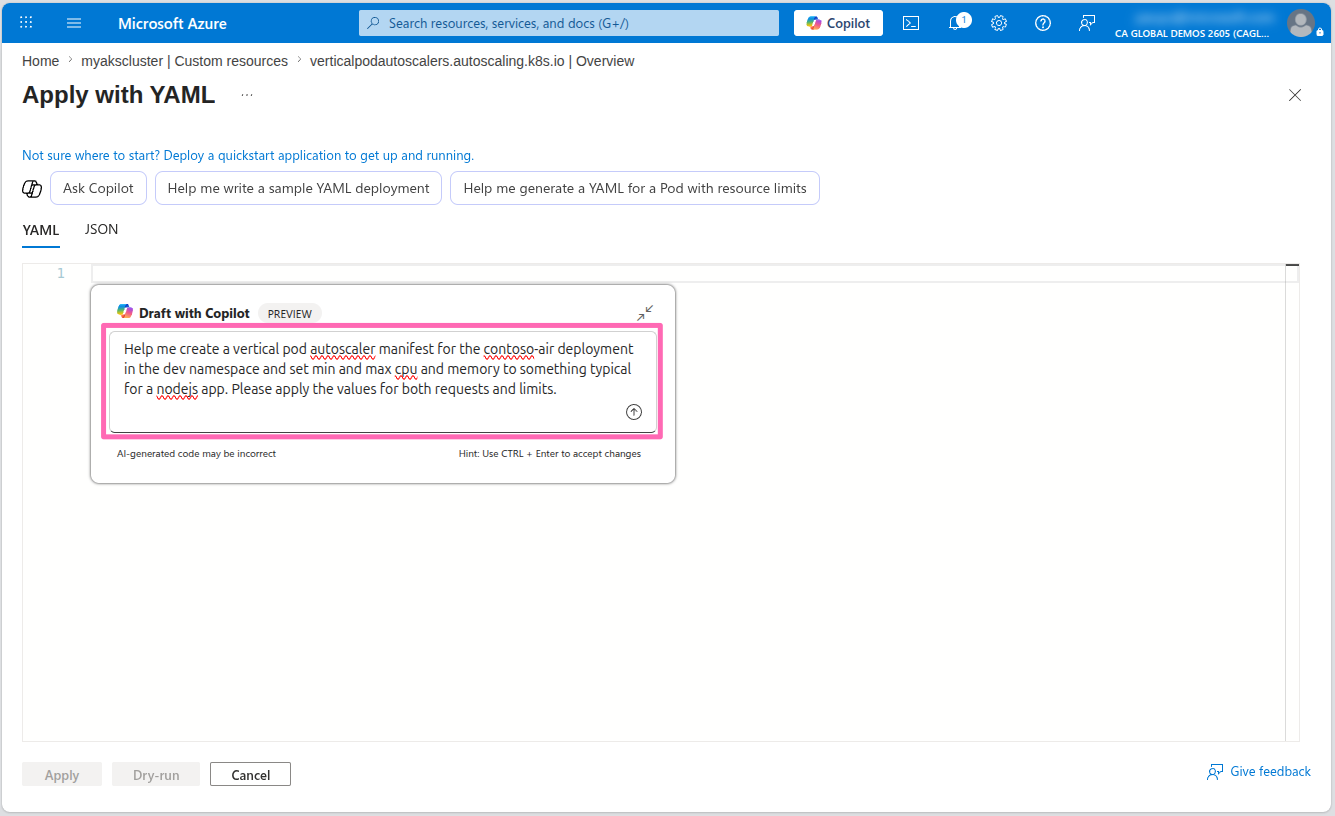
Select Enter to generate the VPA manifest.
When the VPA manifest is generated, select the Accept button to accept the changes and create the VPA resource.
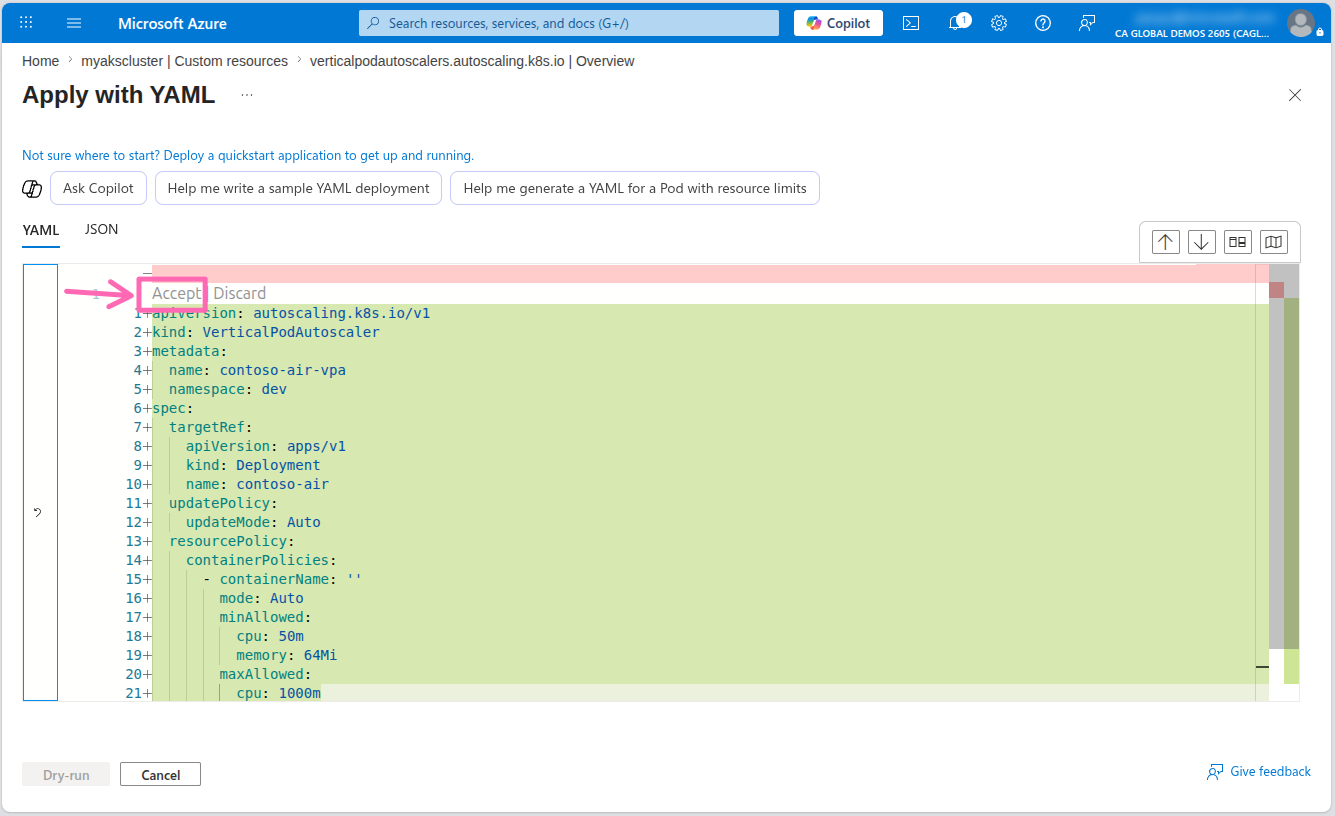
Microsoft Copilot in Azure may provide different results. If your results are different, simply copy the following VPA manifest and paste it into the Apply with YAML editor.
apiVersion: autoscaling.k8s.io/v1
kind: VerticalPodAutoscaler
metadata:
  name: contoso-air-vpa
  namespace: dev
spec:
  targetRef:
    apiVersion: apps/v1
    kind: Deployment
    name: contoso-air
  updatePolicy:
    updateMode: Auto
  resourcePolicy:
    containerPolicies:
      - containerName: contoso-air
        minAllowed:
          cpu: 100m
          memory: 256Mi
        maxAllowed:
          cpu: 1
          memory: 512Mi
        controlledResources: ["cpu", "memory"]
The VPA resource will only update the CPU and memory requests and limits for the pods in the deployment if the number of replicas is greater than 1. Also the pod will be restarted when the VPA resource updates the pod configuration so it is important to create Pod Disruption Budgets (PDBs) to ensure that the pods are not restarted all at once.
KEDA scaler setup
AKS Automatic also comes with the KEDA controller pre-installed, so you can use the KEDA resource immediately by simply deploying a KEDA scaler to your cluster.
KEDA works with the Horizontal Pod Autoscaler (HPA) to scale your applications based on external metrics. It automatically creates an HPA resource when you create a KEDA ScaledObject resource and takes ownership of it. If you already have an existing HPA resource, you can transfer ownership so that KEDA manages it instead of creating one.
When the contoso-air application was deployed with AKS Automated Deployments, an HPA resource was automatically created. Instead of transferring ownership, you'll delete the existing HPA resource and let KEDA recreate it.
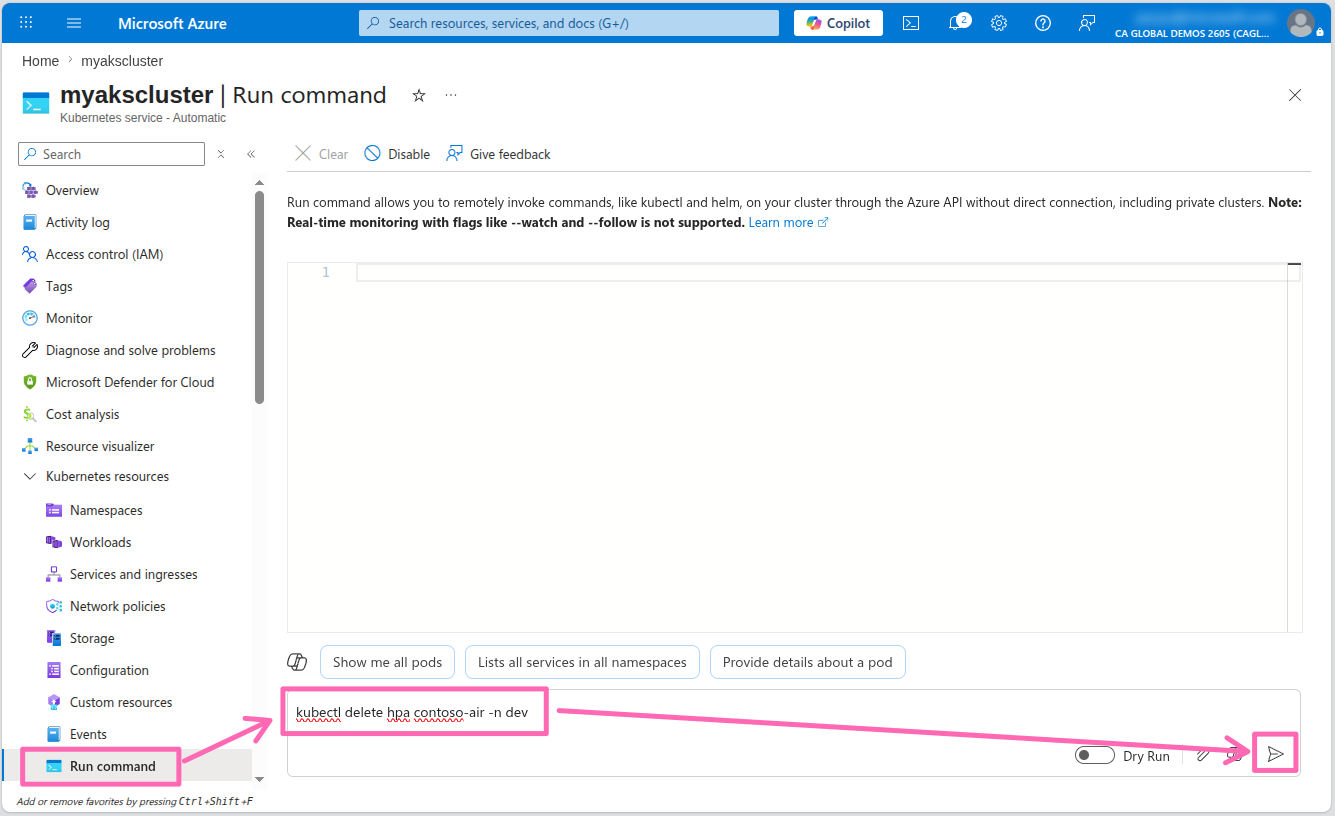
To delete the existing HPA resource, navigate to the Run command section under Kubernetes resources in the AKS cluster menu. In the command editor, run the following command:
kubectl delete hpa contoso-air -n dev
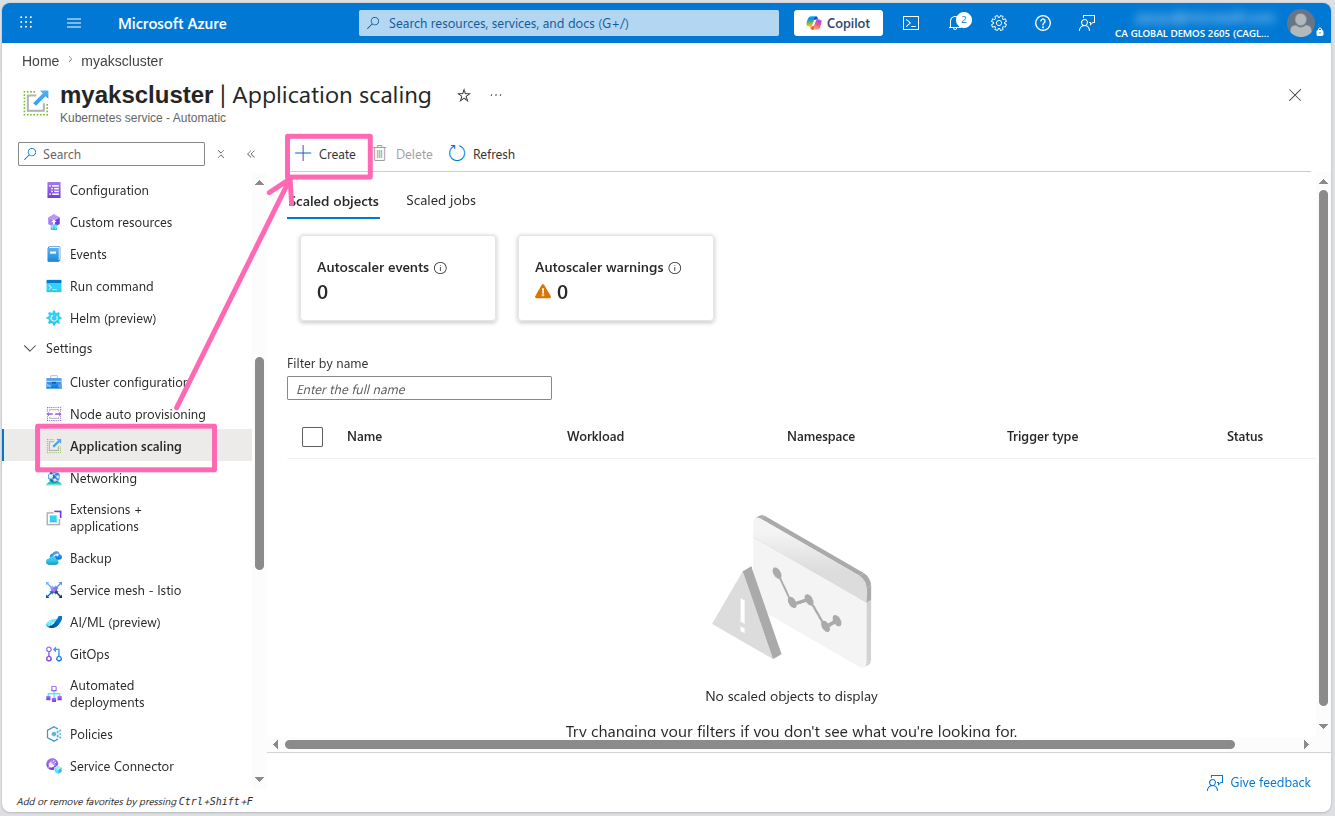
Navigate to Application scaling under Settings in the AKS cluster menu, then select the + Create button.
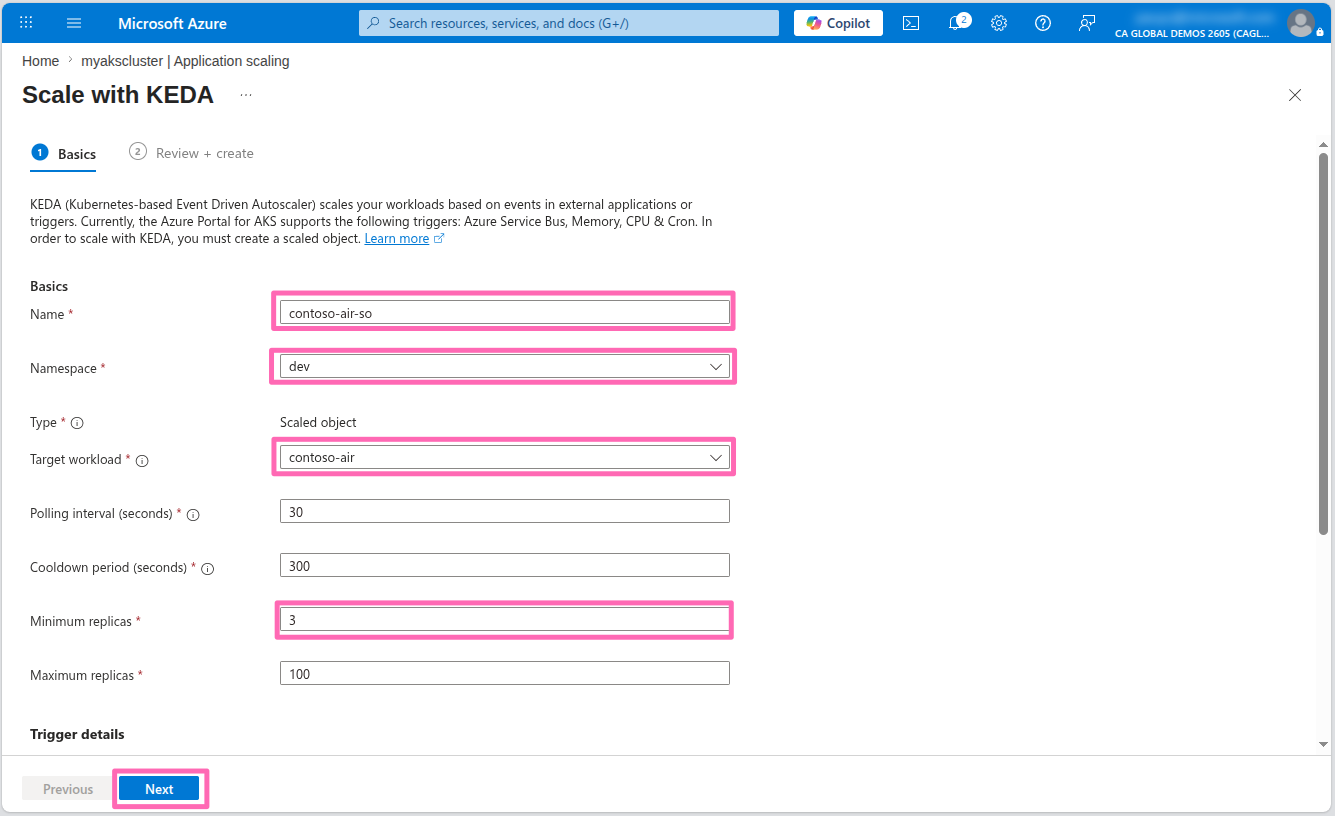
In the Basics section, enter the following details:
- Name: Enter
contoso-air-so - Namespace: Select dev
- Target workload: Select contoso-air
- Minimum replicas: Enter
3
In the Trigger details section, enter the following details:
- Trigger type: Select CPU
Leave the rest of the fields as their default values and select Next.
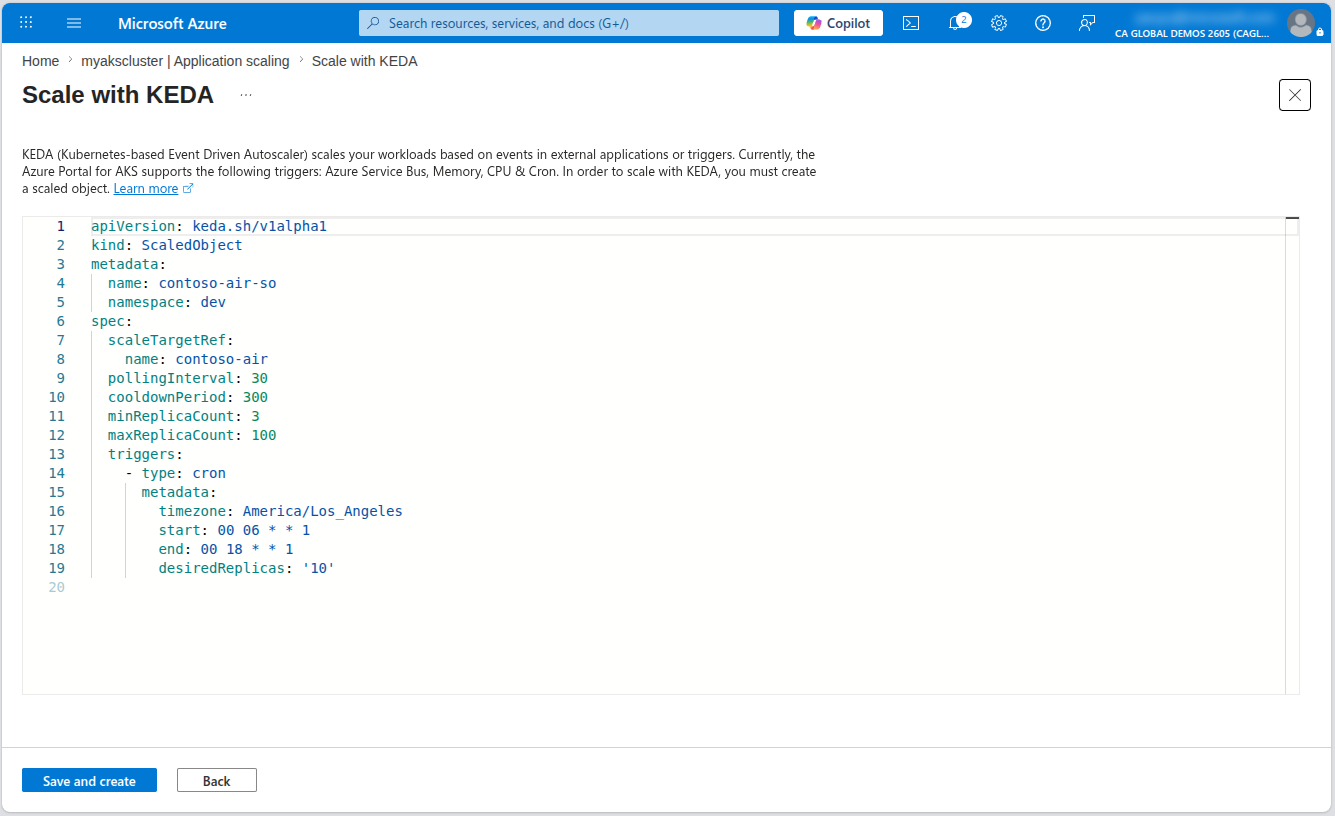
In the Review + create tab, select Customize with YAML to view the YAML manifest for the ScaledObject resource. You can see the YAML manifest the AKS portal generated for the ScaledObject resource. Here you can add additional configuration to the ScaledObject resource if needed.
Select Save and create to create the ScaledObject resource.
Head over to the Workloads section in the menu under Kubernetes resources. In the Filter by namespace drop-down list, select dev. You should see the contoso-air deployment is now running (or starting) 3 replicas.
Now that the number of replicas has been increased, the VPA resource will be able to adjust the CPU and memory requests and limits for the pods in the deployment based on the actual resource utilization of the pods the next time it reconciles.
This was a simple example of using KEDA. The real power of KEDA comes from its ability to scale your application based on external metrics. There are many scalers available that you can use to scale your application based on a variety of external metrics.
If you have time, try to run a simple load test to see the scaling in action. You can use the hey tool to generate some traffic to the application.
If you don't have the hey tool installed, check out the installation guide and follow the instructions based on your operating system.
Run the following command to generate some traffic to the application:
hey -z 30s -c 100 http://<REPLACE_THIS_WITH_CONTOSO_AIR_SERVICE_IP>
This will generate some traffic to the application for 30 seconds. You should see the number of replicas for the contoso-air deployment increase as the load increases.
Summary
In this workshop, you learned how to create an AKS Automatic cluster and deploy an application using Automated Deployments. You then integrated your application with Azure OpenAI using the AKS Service Connector and Workload Identity. You also enabled application monitoring with AutoInstrumentation using Azure Monitor Application Insights for deep visibility into performance without code changes. Finally, you configured resource-specific scaling with the Vertical Pod Autoscaler (VPA) and event-driven scaling with KEDA.
Hopefully, you now have a better understanding of how easy it can be to build and deploy applications on AKS Automatic.
To learn more about AKS Automatic, visit the AKS documentation and check out our other AKS Automatic lab in this repo to explore more features of AKS.
In addition to this workshop, you can also explore the following resources:
- Azure Kubernetes Service (AKS) documentation
- Kubernetes: Getting started
- Learning Path: Introduction to Kubernetes on Azure
- Learning Path: Deploy containers by using Azure Kubernetes Service (AKS)
If you have any feedback or suggestions for this workshop, please feel free to open an issue or pull request in the GitHub repository.
Cleanup
To clean up the resources created in this lab, run the following command to delete the resource group. If you want to use the resources again, you can skip this step.
az group delete \
--name ${RG_NAME} \
--yes \
--no-wait
This will delete the resource group and all its contents.