Deploy AI Models with KAITO and Headlamp
Kubernetes AI Toolchain Operator (KAITO) is an open-source operator designed to automate AI/ML model inference and tuning workloads within Kubernetes clusters. It focuses on popular large models from Hugging Face such as Falcon, Phi-3, and more, while providing key capabilities including:
- Managing large model files using container images
- Providing preset configurations optimized for different GPU hardware
- Supporting popular inference runtimes such as vLLM and transformers
- Automating GPU node provisioning based on specific model requirements
- Hosting large model images in public registries when permissible
This workshop will guide you through deploying and developing AI inference workloads on Azure Kubernetes Service (AKS) using KAITO.
KAITO can be deployed in two ways on AKS:
- AKS add-on: This is the easiest way to deploy KAITO on AKS however you will be limited in terms of getting the latest features and updates as soon as they are available upstream. This feature can be enabled using Azure CLI or the Visual Studio Code (VS Code) extension.
- Open source: This requires more steps to deploy but you will have access to the latest features and updates as soon as they are available. To deploy open-source KAITO on AKS, you can deploy with Terraform or deploy with Helm and Azure CLI.
In this workshop, we'll focus on using the AKS add-on approach for deploying KAITO, as it provides the simplest and most streamlined experience for getting started with AI/ML workloads on AKS.
Objectives
After completing this workshop, you will be able to:
- Install the KAITO add-on for AKS
- Deploy a KAITO preset workspace with a custom VM size
- Build inference applications using the KAITO workspace
- Test KAITO's vLLM endpoint using the OpenAI API
- Monitor the performance of the KAITO workspace and GPU nodes using Azure Managed Prometheus and Grafana
Prerequisites
Before you begin, you will need an Azure subscription with Owner permissions and a GitHub account.
In addition, you will need the following tools installed on your local machine:
- Visual Studio Code with the following extensions:
- Azure CLI
- GitHub CLI
- Git
- kubectl
- Headlamp for managing Kubernetes resources via a GUI
- Python 3.13 or later for python development
- uv for managing Python dependencies and projects
- REST Client VS Code extension for quickly testing HTTP requests
- POSIX-compliant shell (bash, zsh, Azure Cloud Shell)
Setup Azure CLI
Start by logging into Azure by run the following command and follow the prompts:
az login --use-device-code
You can log into a different tenant by passing in the --tenant flag to specify your tenant domain or tenant ID.
Run the following command to register preview features.
az extension add --name aks-preview
Setup Resource Group
In this workshop, we will set environment variables for the resource group name and location.
The following commands will set the environment variables for your current terminal session. If you close the current terminal session, you will need to set the environment variables again.
To keep the resource names unique, we will use a random number as a suffix for the resource names. This will also help you to avoid naming conflicts with other resources in your Azure subscription.
Run the following command to generate a random number.
RAND=$RANDOM
export RAND
echo "Random resource identifier will be: ${RAND}"
Set the location to a region of your choice. For example, eastus or westeurope but you should make sure this region supports availability zones.
export LOCATION=eastus
Create a resource group name using the random number.
export RG_NAME=myresourcegroup$RAND
You can list the regions that support availability zones with the following command:
az account list-locations \
--query "[?metadata.regionType=='Physical' && metadata.supportsAvailabilityZones==true].{Region:name}" \
--output table
Run the following command to create a resource group using the environment variables you just created.
az group create \
--name ${RG_NAME} \
--location ${LOCATION}
Setup Resources
To keep focus on AKS-specific features, this workshop will need some Azure preview features enabled and resources to be pre-provisioned.
This lab will require the use of multiple Azure resources including:
- Azure Log Analytics Workspace for container insights and application insights
- Azure Monitor Workspace for Prometheus metrics
- Azure Container Registry for storing container images
- Azure Key Vault for secrets management
- Azure User-Assigned Managed Identity for accessing Azure services via Workload Identity
You can deploy these resources using a single ARM template.
To deploy this ARM template. Run the following command to save your user object ID to a variable.
export USER_ID=$(az ad signed-in-user show --query id -o tsv)
Run the following command to deploy Bicep template into the resource group.
az deployment group create \
--resource-group ${RG_NAME} \
--name ${RG_NAME}-deployment \
--template-uri https://raw.githubusercontent.com/azure-samples/aks-labs/refs/heads/main/docs/getting-started/assets/aks-labs-deploy.json \
--parameters userObjectId=${USER_ID} \
--no-wait
The --no-wait flag is used to run the deployment in the background. This will allow you to continue while the resources are being deployed.
This deployment will take a few minutes to complete. Move on to the next section while the resources are being deployed.
Setup AKS Cluster
Set the AKS cluster name.
export AKS_NAME=myakscluster$RAND
Run the following command to create an AKS cluster with some best practices in place.
az aks create \
--resource-group ${RG_NAME} \
--name ${AKS_NAME} \
--location ${LOCATION} \
--network-plugin azure \
--network-plugin-mode overlay \
--network-dataplane cilium \
--network-policy cilium \
--enable-managed-identity \
--enable-workload-identity \
--enable-oidc-issuer \
--ssh-access disabled
The AKS cluster created for this lab only includes a few best practices such as enabling Workload Identity and setting the cluster networking to Azure CNI powered by Cilium. For complete guidance on implementing AKS best practices be sure to check out the best practices and baseline architecture for an AKS cluster guides on Microsoft Learn.
Once the AKS cluster has been created, run the following command to connect to it.
az aks get-credentials \
--resource-group ${RG_NAME} \
--name ${AKS_NAME}
You should also configure observability to monitor your KAITO workspaces and AI inference workloads.
The Azure resource deployment from the section above should be completed by now, so retrieve the resource IDs from the deployment:
METRICS_WORKSPACE_ID=$(az deployment group show \
--name "${RG_NAME}-deployment" \
--resource-group ${RG_NAME} \
--query "properties.outputs.metricsWorkspaceId.value" \
--output tsv)

GRAFANA_DASHBOARD_ID=$(az deployment group show \
--name "${RG_NAME}-deployment" \
--resource-group ${RG_NAME} \
--query "properties.outputs.grafanaDashboardId.value" \
--output tsv)
Enable Azure Monitor metrics on your AKS cluster and link it to Grafana:
az aks update \
--name ${AKS_NAME} \
--resource-group ${RG_NAME} \
--enable-azure-monitor-metrics \
--azure-monitor-workspace-resource-id ${METRICS_WORKSPACE_ID} \
--grafana-resource-id ${GRAFANA_DASHBOARD_ID}
This enables Prometheus metrics collection and visualization through Azure Managed Grafana. Later in this workshop, you'll configure additional monitoring for KAITO workspace metrics.
Install the AKS add-on
In this workshop, you will be using the AKS add-on to deploy KAITO on AKS. This is the easiest way to deploy the add-on is by using the AKS extension for VS Code.
To learn more about the AKS add-on and VS Code extension for KAITO, check out this video.
Install KAITO with VS Code
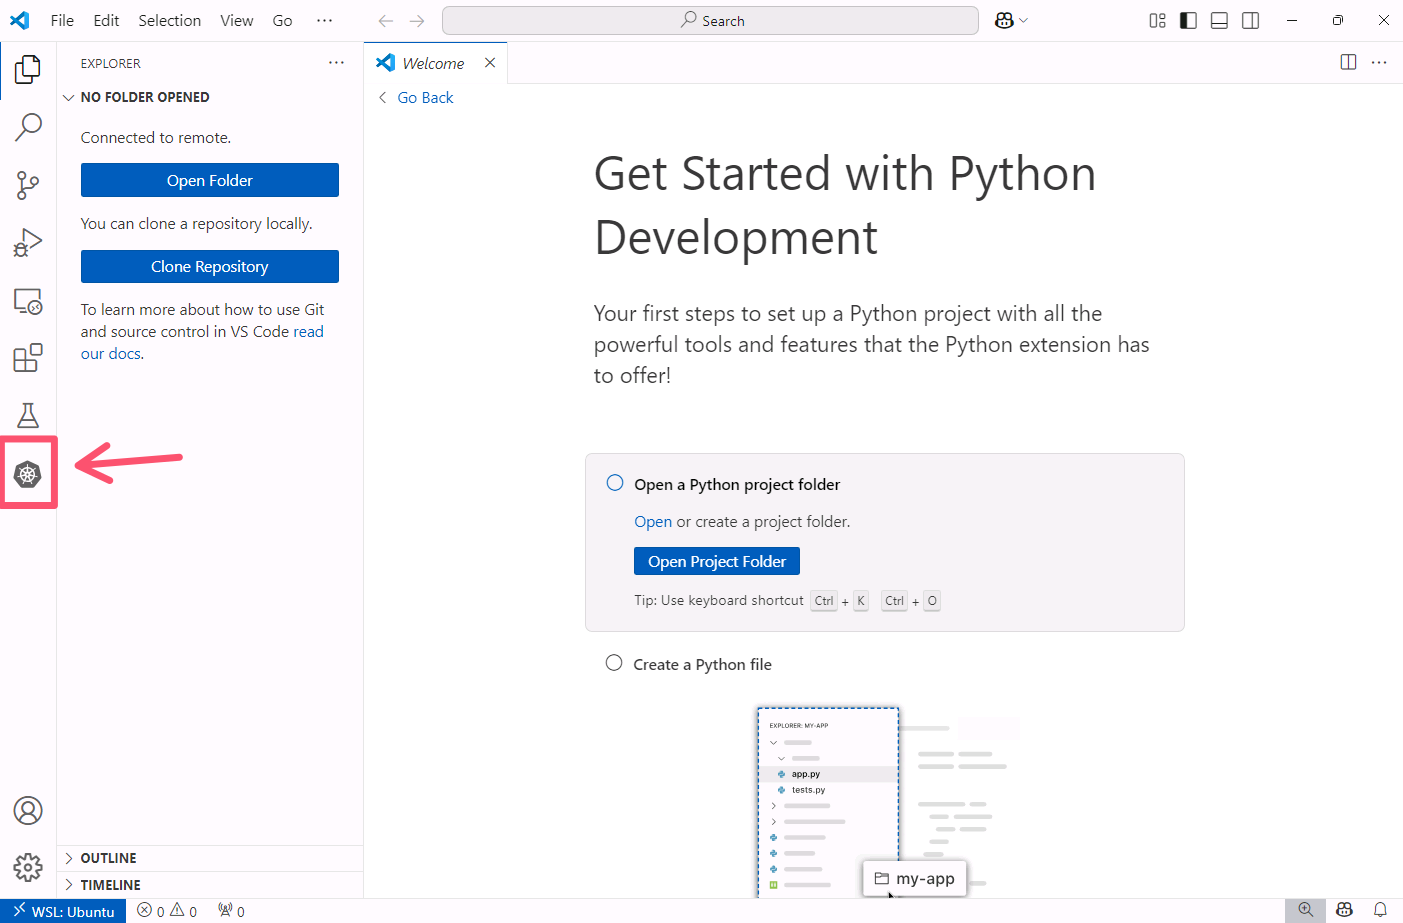
In VS Code, click on the Kubernetes extension icon in the left sidebar.
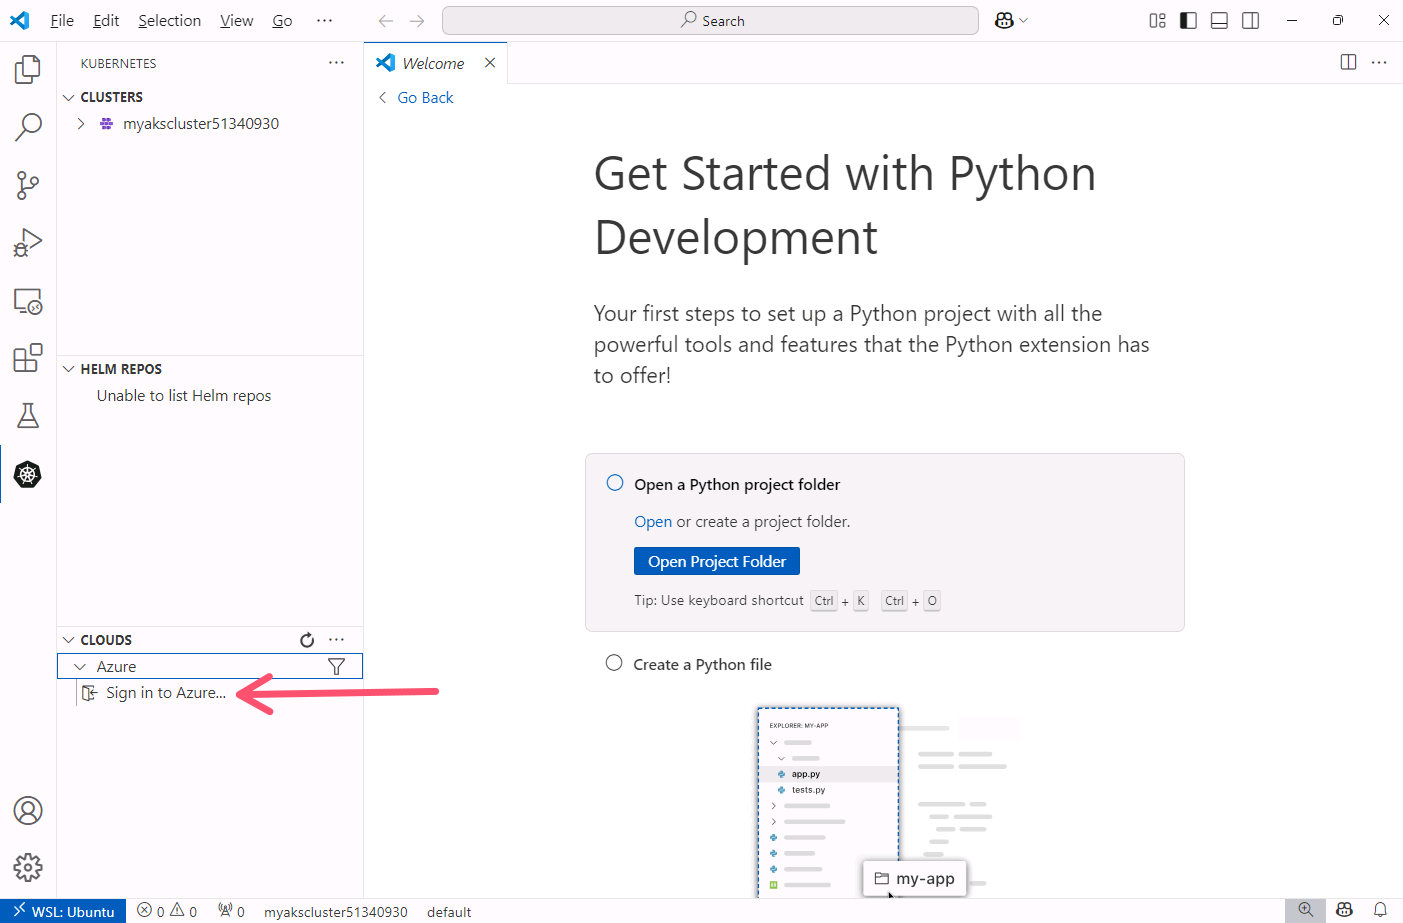
In the Clouds section, expand the Azure section, then click on Sign in to Azure.
You will see a pop-up windows indicating the Azure Kubernetes Service extension wants to sign in. Click the Allow button then sign in with your Azure account.
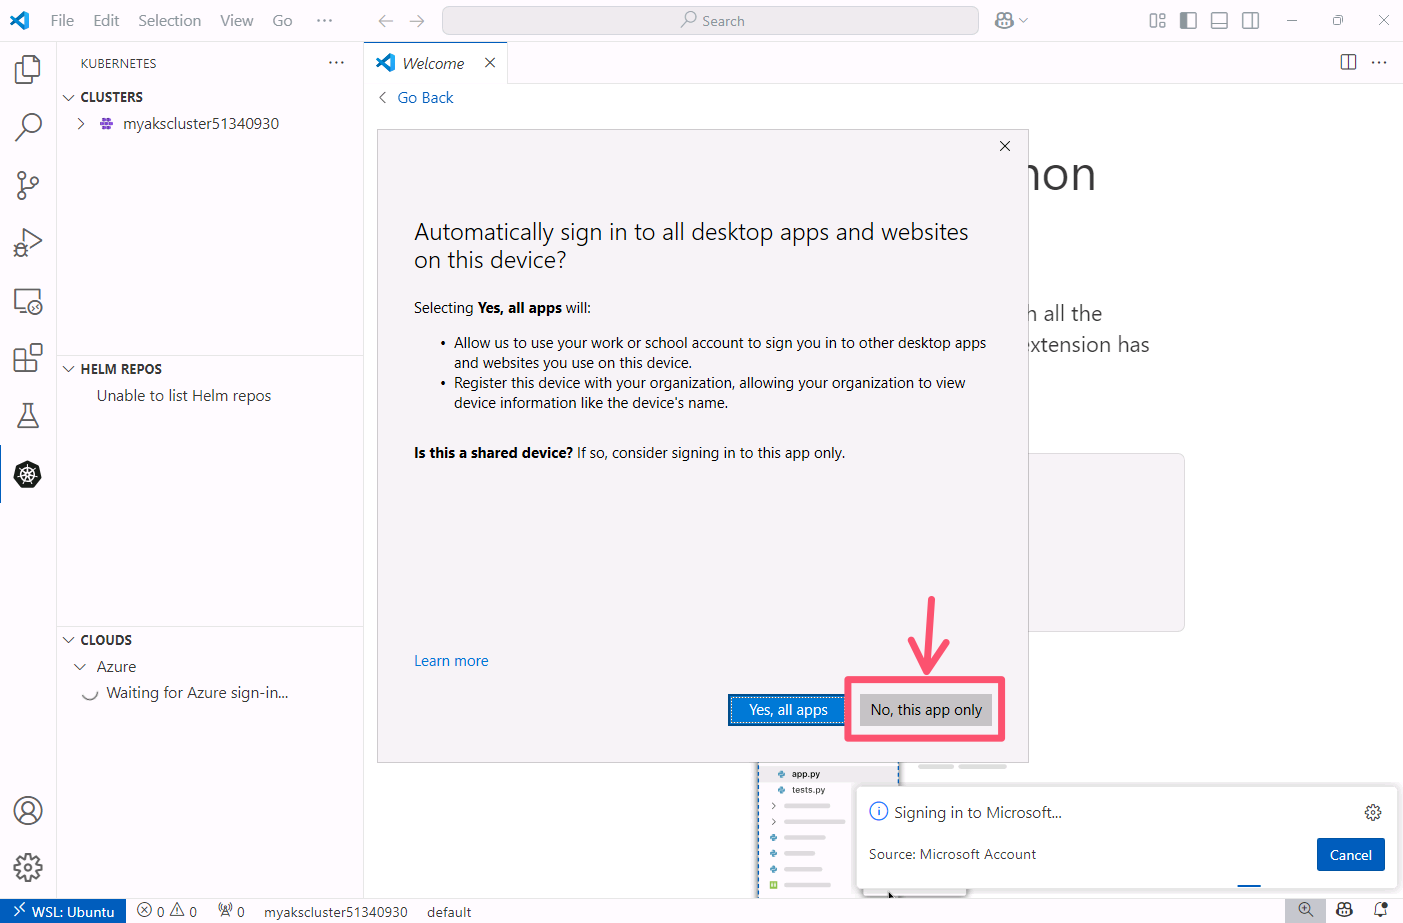
After logging in, you may be asked to "Automatically sign in to all desktop apps and websites on this device?" If so, click the No, this app only button.
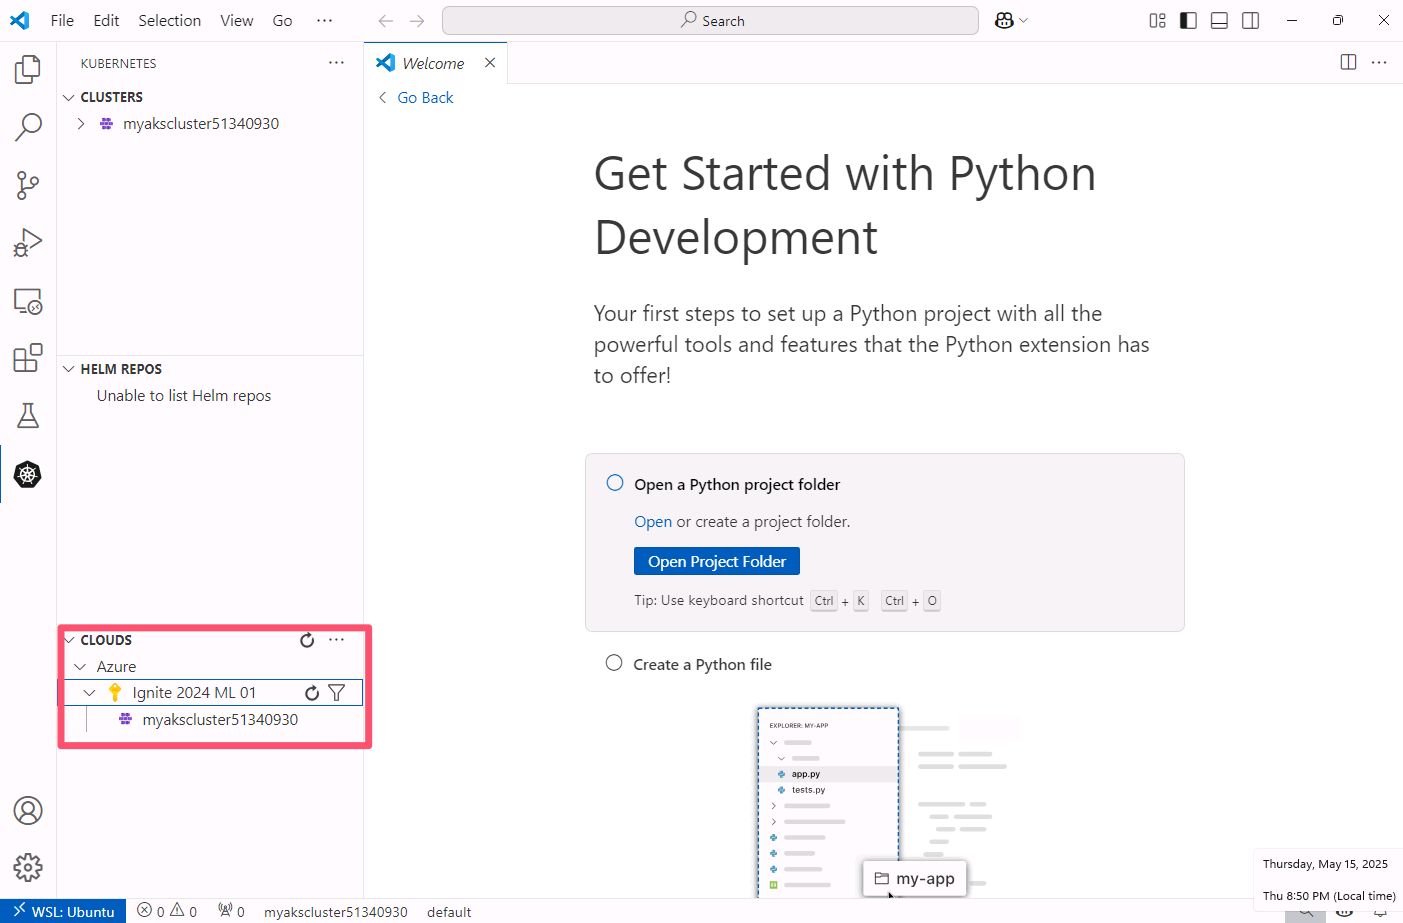
You should see a list of your Azure subscriptions. Expand the subscription that contains your AKS cluster and locate your AKS cluster.
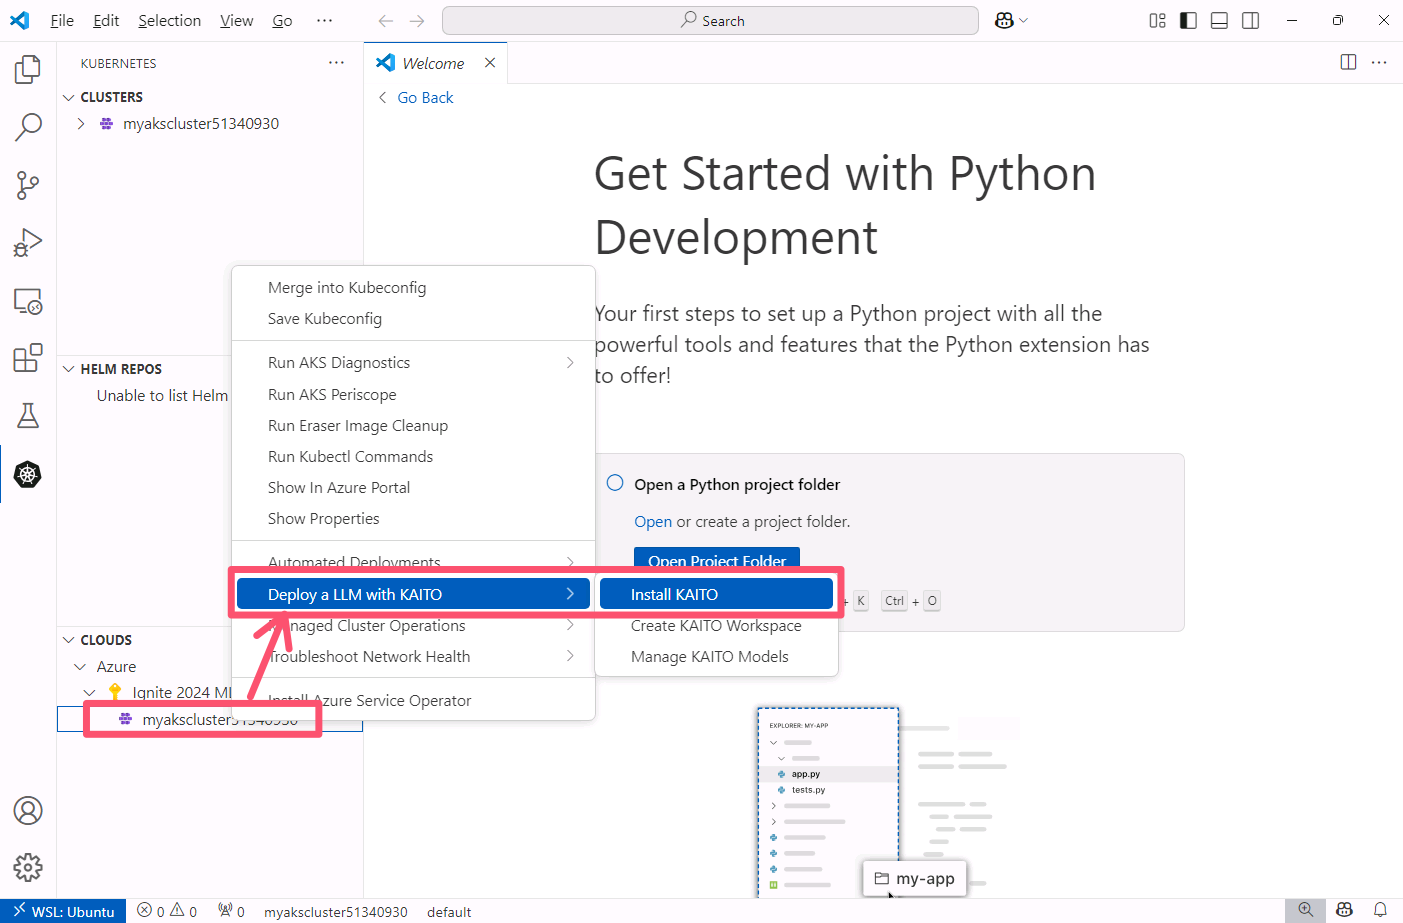
Right-click your AKS cluster, select Deploy a LLM with KAITO and click Install KAITO.
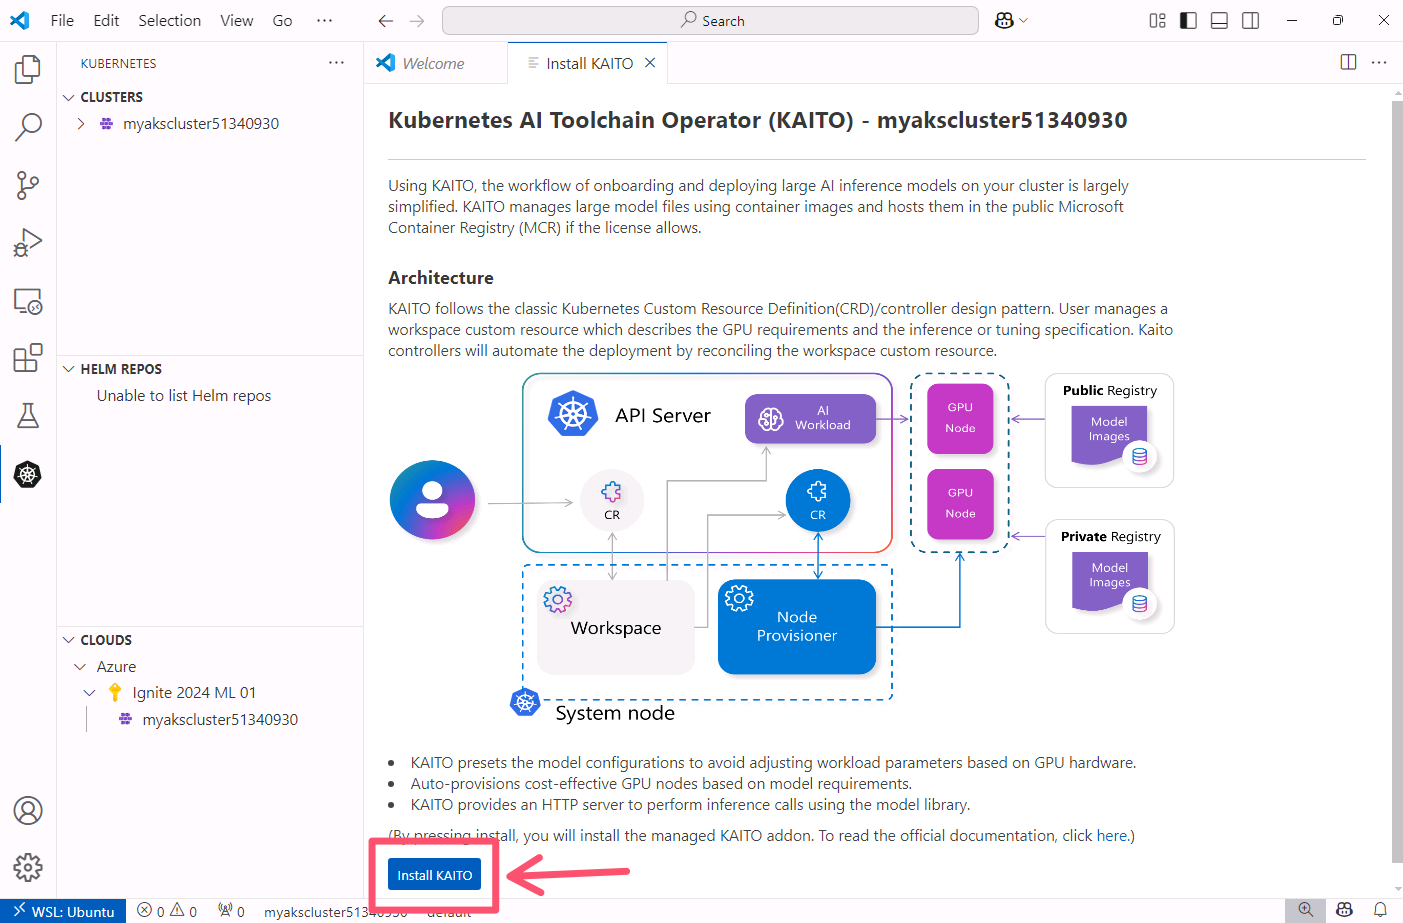
The Install KAITO tab will open. Click the Install KAITO button at the bottom of the tab.
Installing KAITO can take up to 15 minutes to complete. Once the installation is complete, you will see a message at the bottom of the tab indicating that KAITO has been installed successfully.
While you wait for the installation to complete, move on to the next section to learn about the KAITO architecture.
KAITO Architecture
The architecture of KAITO follows the Kubernetes operator design pattern. It is comprised of two controllers, Workspace and GPU provisioner. As a user, you will only manage a workspace custom resource. This is where you can define your model and GPU specification (VM SKU). The GPU provisioner is built on top of Karpenter APIs and is responsible for provisioning GPU nodes.
When you submit a workspace custom resource to the Kubernetes API server, the Workspace controller creates a NodeClaim custom resource and waits for the GPU provisioner controller to provision a node and configures necessary GPU drivers and libraries to support the model all of which would have been manual steps without KAITO.
Once the GPU node is provisioned, the Workspace controller will proceed to deploy the inference workload using the specified configuration. This configuration can be a custom Pod template that you create, but the best part of KAITO is it's support for preset configurations. Presets are pre-built, optimal GPU configuration for specific models. The Workspace controller creates the Pod and proceeds to pull down the containerized model and run a model inference server which is exposed via a Kubernetes Service, allowing users to access it through a REST API.
KAITO supports both Hugging Face Transformers and vLLM as inference runtime but defaults to vLLM for performance, efficiency, compatibility with the OpenAI API, and support for metrics out-of-the-box.
Managing KAITO with Headlamp
Headlamp is a Kubernetes Dashboard application that provides a graphical interface for managing Kubernetes resources. It is developed as an open-source project by Microsoft and has recently been accepted into the core Kubernetes project within the Kubernetes SIG UI.
Headlamp focuses on extensibility and user experience, making it easy to customize and extend with plugins. It supports multiple clusters, real-time updates, and provides a modern, intuitive interface for both beginners and experienced Kubernetes users.
The KAITO project provides a dedicated Headlamp plugin that enhances the Headlamp interface with specialized features for managing KAITO workspaces, making it even easier to deploy and monitor AI models directly from the dashboard.
To explore more about Headlamp, check out:
- Official website for downloads and documentation
- GitHub repository for source code and contributions
- Plugin development guide for creating custom extensions
To learn more about Headlamp, check out this video.
Install KAITO plugin
With the KAITO add-on installed, we can use Headlamp to work with and manage KAITO resources.
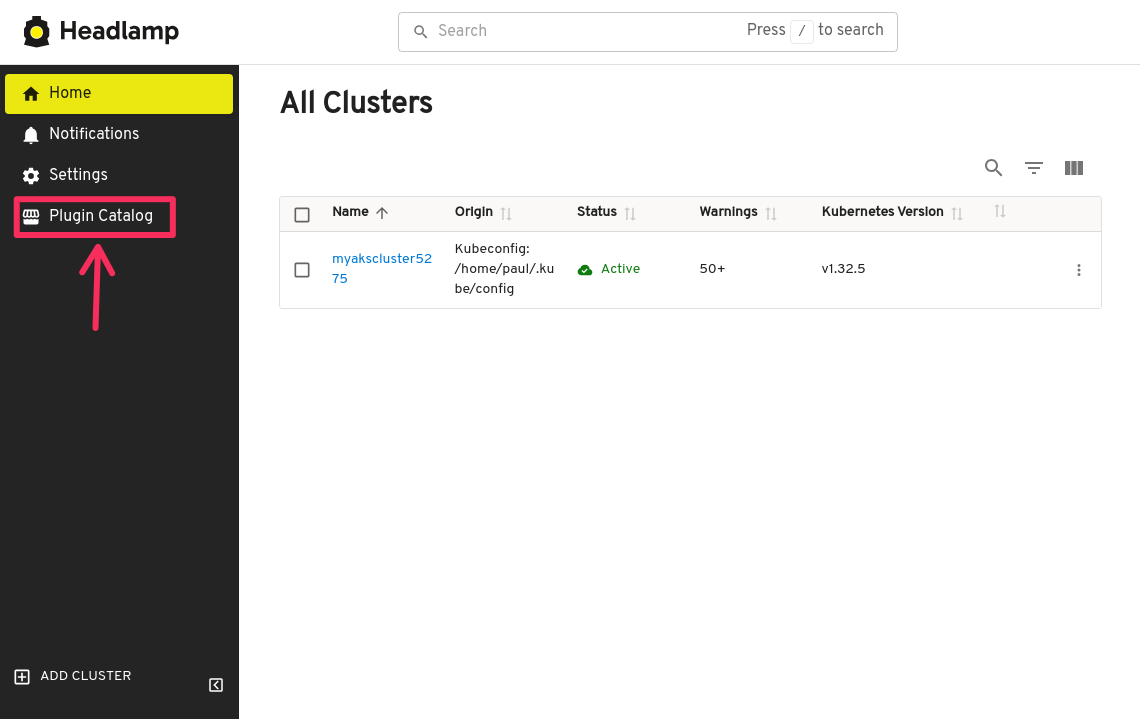
Open the Headlamp application then click on Plugin Catalog.
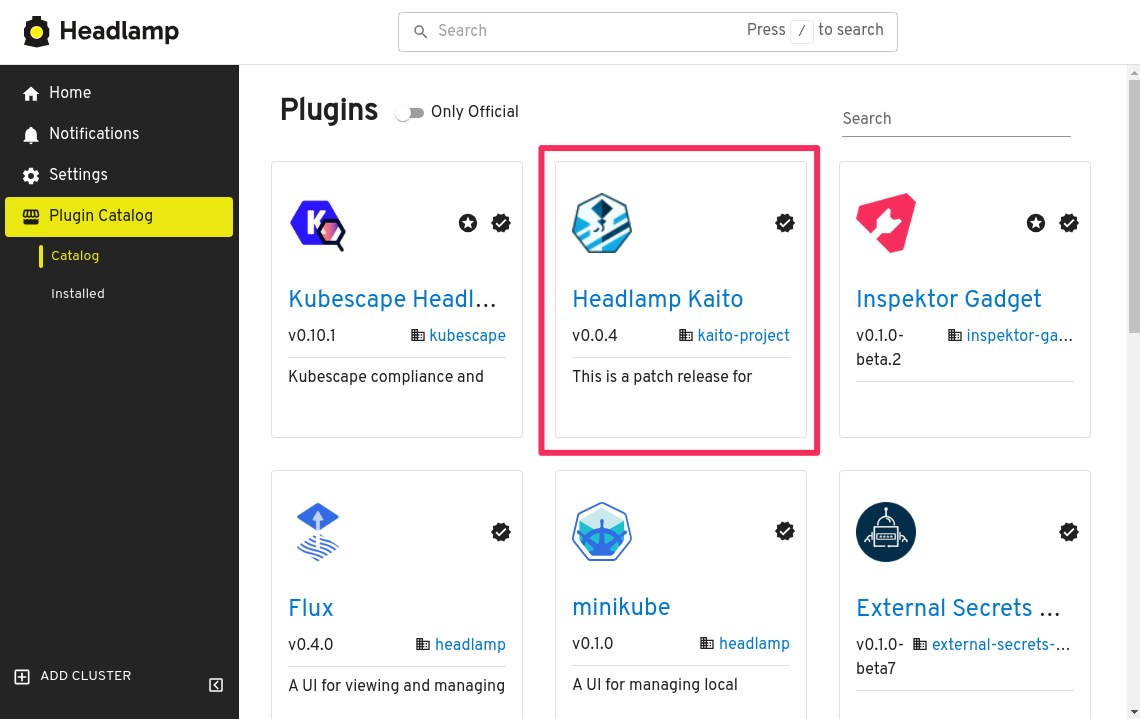
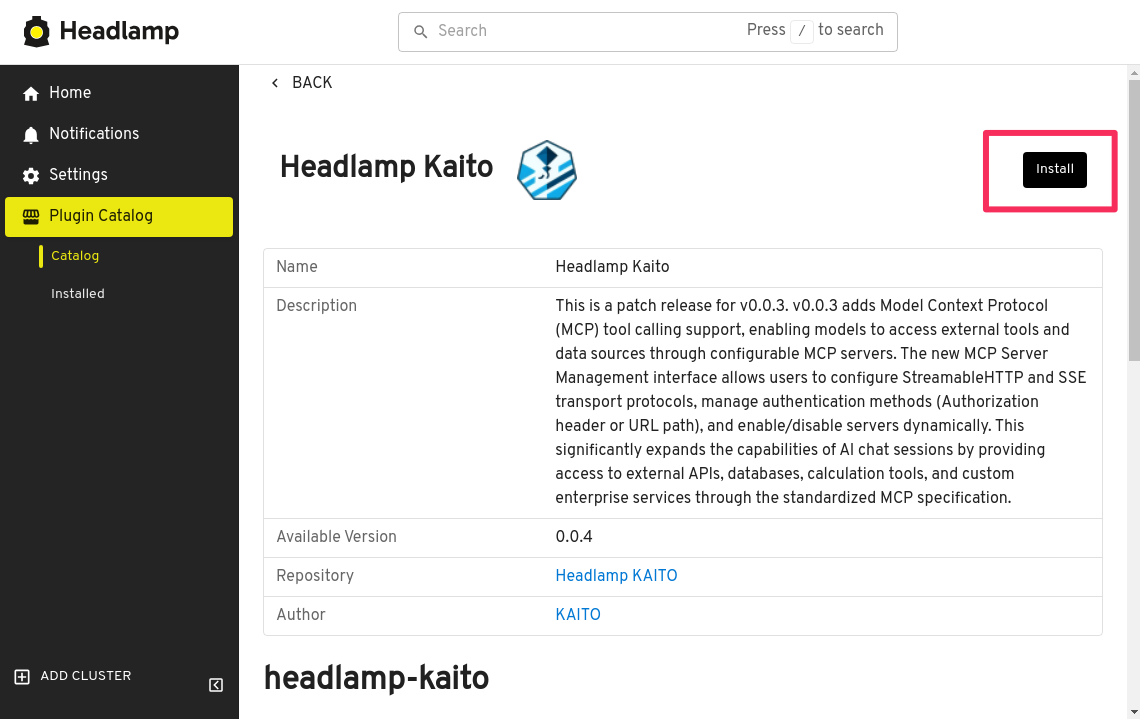
In the plugin catalog page, find and click Headlamp Kaito.
Click on the Install button in the top right corner of the page, then confirm the installation.
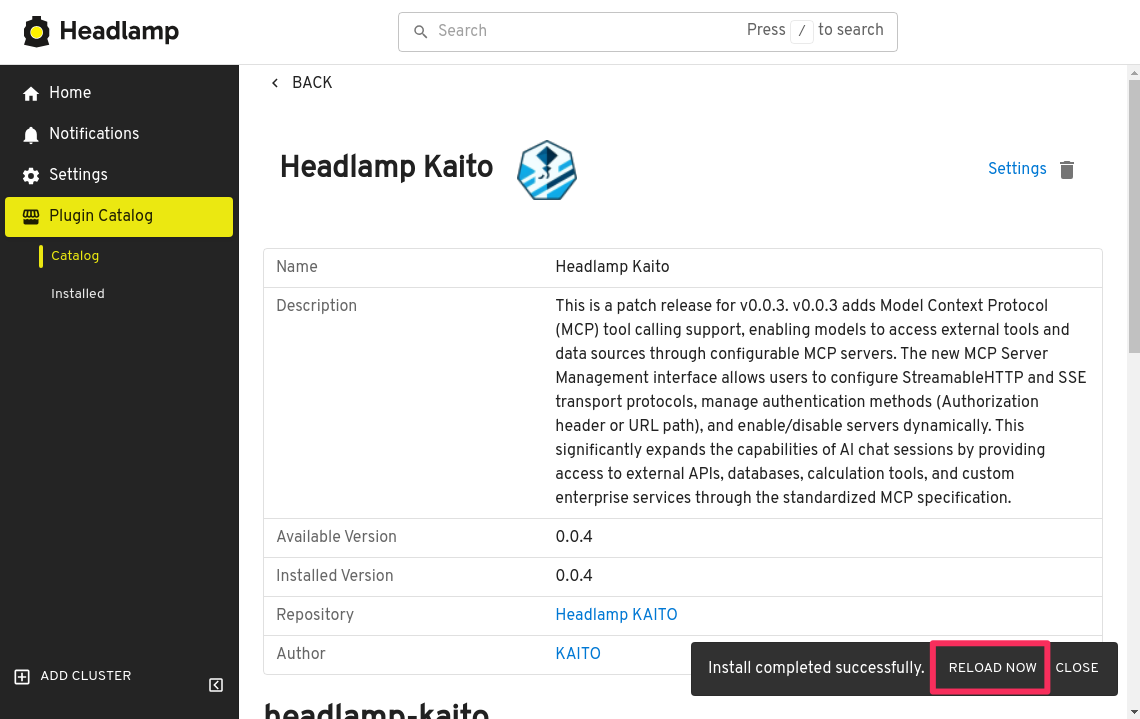
With the plugin installed, click the Reload now button at the bottom of the page.
Now head back to the Headlamp home page and click your cluster to connect to it.
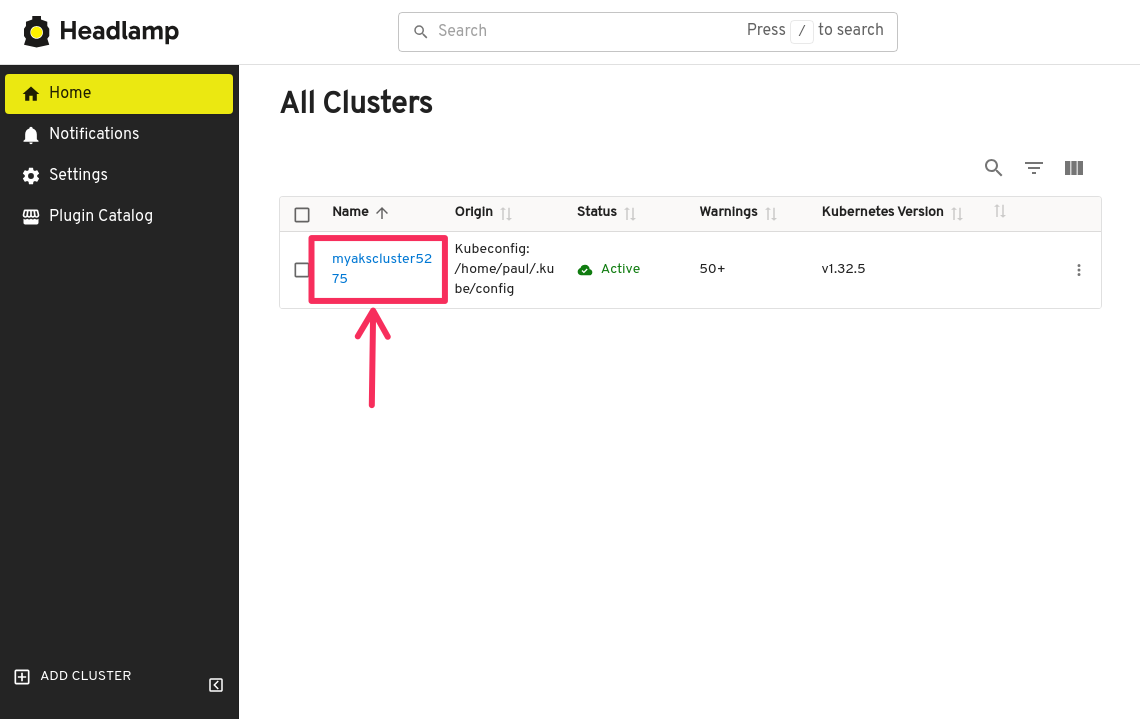
Headlamp will automatically detect the AKS cluster based on the kubeconfig file it finds in your home directory. If you don't see your AKS cluster, you will need to run the az aks get-credentials command to download the kubeconfig file.
Deploy Workspace
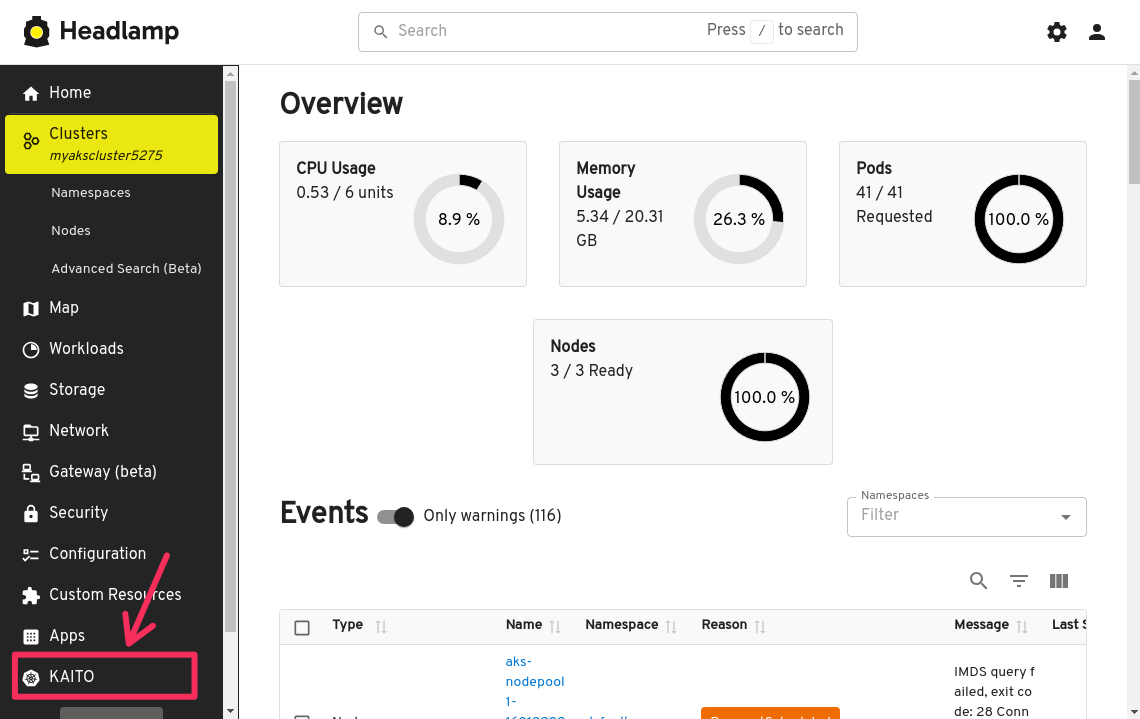
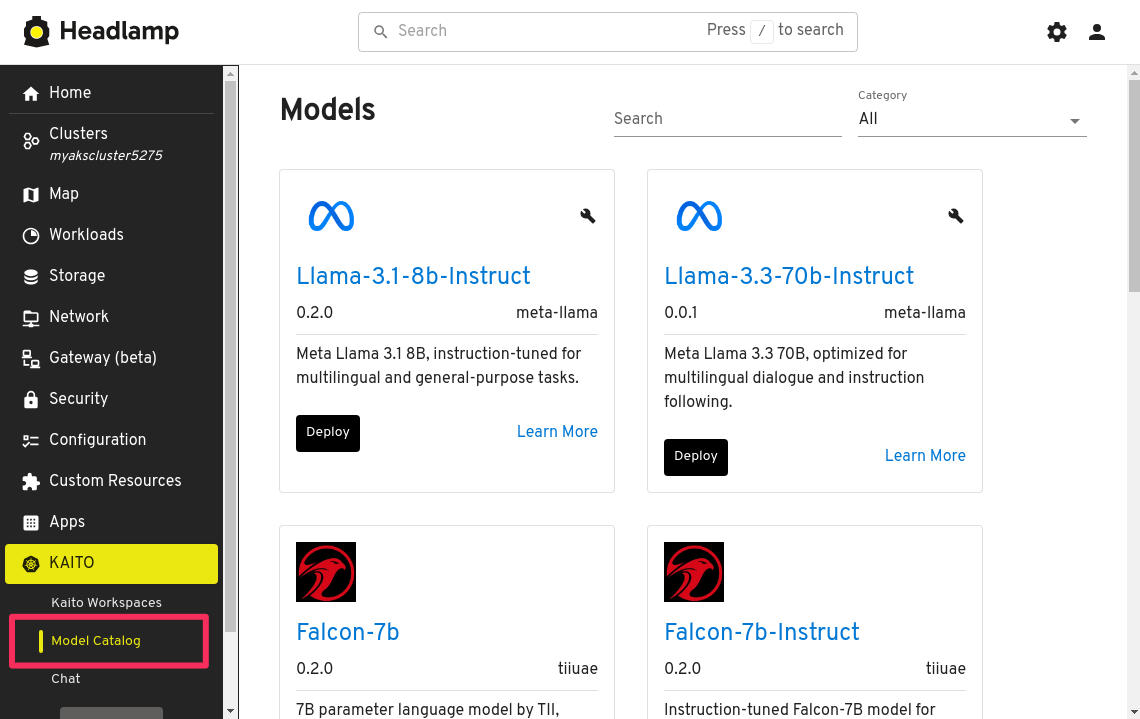
With the KAITO add-on installed, you can now deploy a workspace custom resource by clicking on the KAITO button at the bottom of the toolbar on the left side to expand the menu.
With the KAITO menu expanded, click on Model Catalog. This will open a new tab where you will be presented with a list of available preset Workspaces. These are the available models that you can deploy with KAITO.
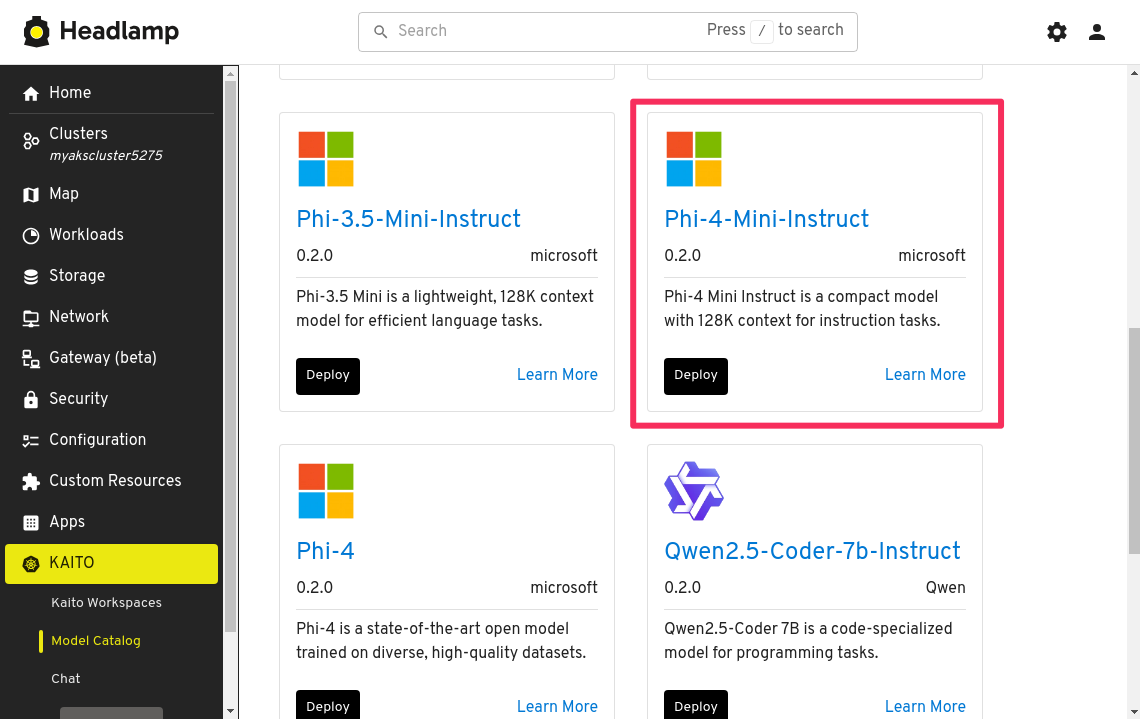
Scroll down and page through the list of available models until you find the Phi-4-Mini-Instruct, then click Deploy.
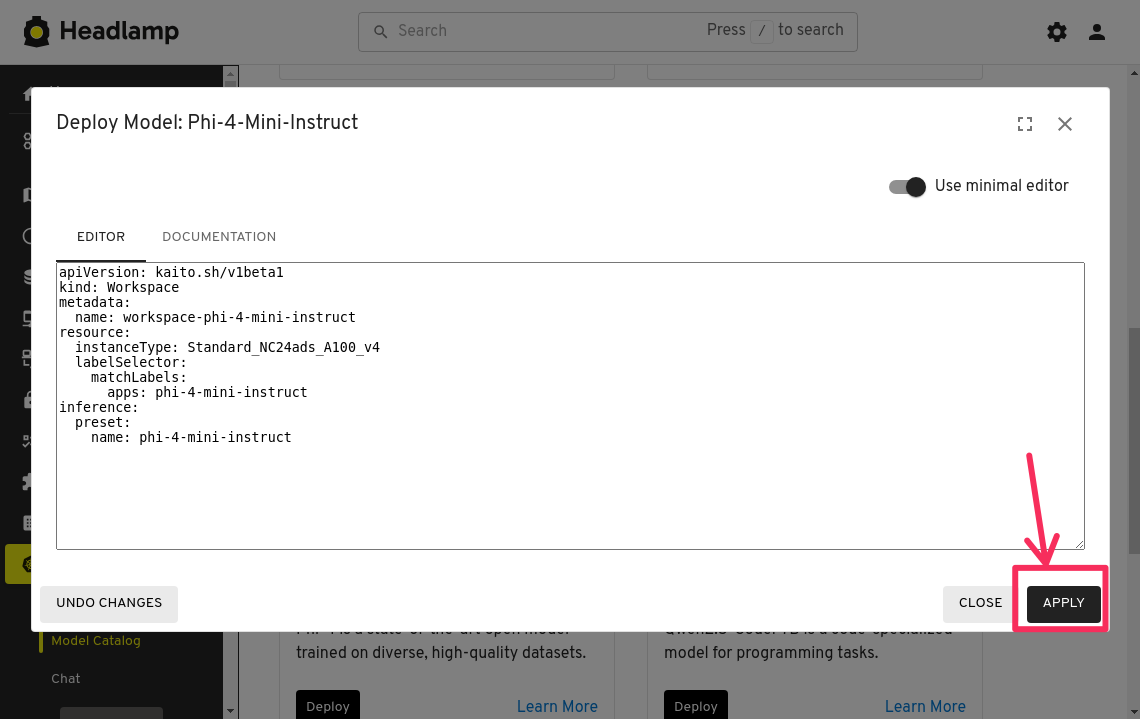
In the panel that opens up, you will be presented with the YAML manifest for the workspace. Here you will have the option to deploy the default workspace or a customized workspace by modifying the YAML.
The default workspace is a preset configuration that has been optimized for the most cost-effective VM size that meets the requirements of the model. This is the recommended option for most users. However, you can customize the workspace to use a different VM size if you have specific requirements or if you want to use a VM size that you have sufficient quota for.
Keep the manifest as-is and click the Apply button to create the workspace.
GPU Quota Requirements: This workspace requires sufficient GPU quota in your Azure subscription to deploy successfully.
Minimum Requirements:
- Preferred: At least 24 vCPUs of Standard NCads A100 v4 GPU quota
Alternative Options (if you don't have NCads A100 v4 quota, you could choose a VM SKU from the following families):
- NCasT4_v3 series GPU VMs
- NVadsA10_v5 series GPU VMs
No GPU quota available? You'll need to request additional quota from Azure support before proceeding.
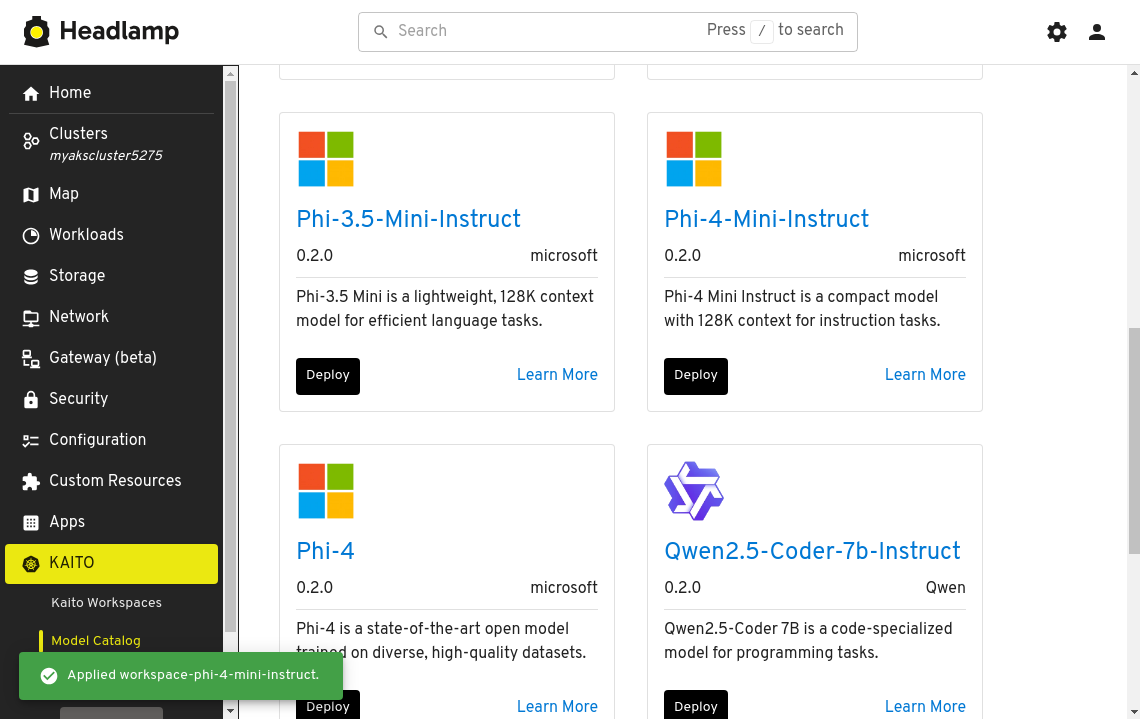
You should see a notification at the bottom indicating the workspace has been successfully applied.
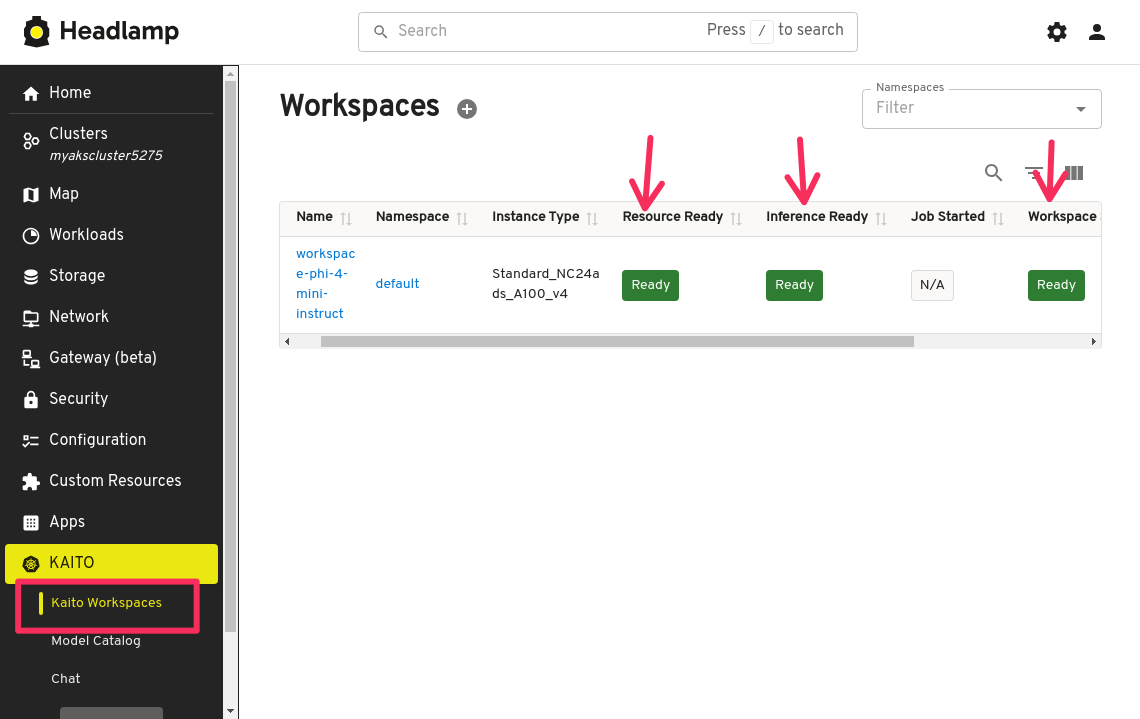
Now let's check the status of the workspace. Click on the Kaito Workspaces menu item and you will see the workspace deployment progress. Keep an eye on the Resource Ready, Inference Ready, and Workspace Ready statuses. The workspace deployment can take up to 15 minutes to complete.
Test Workspace
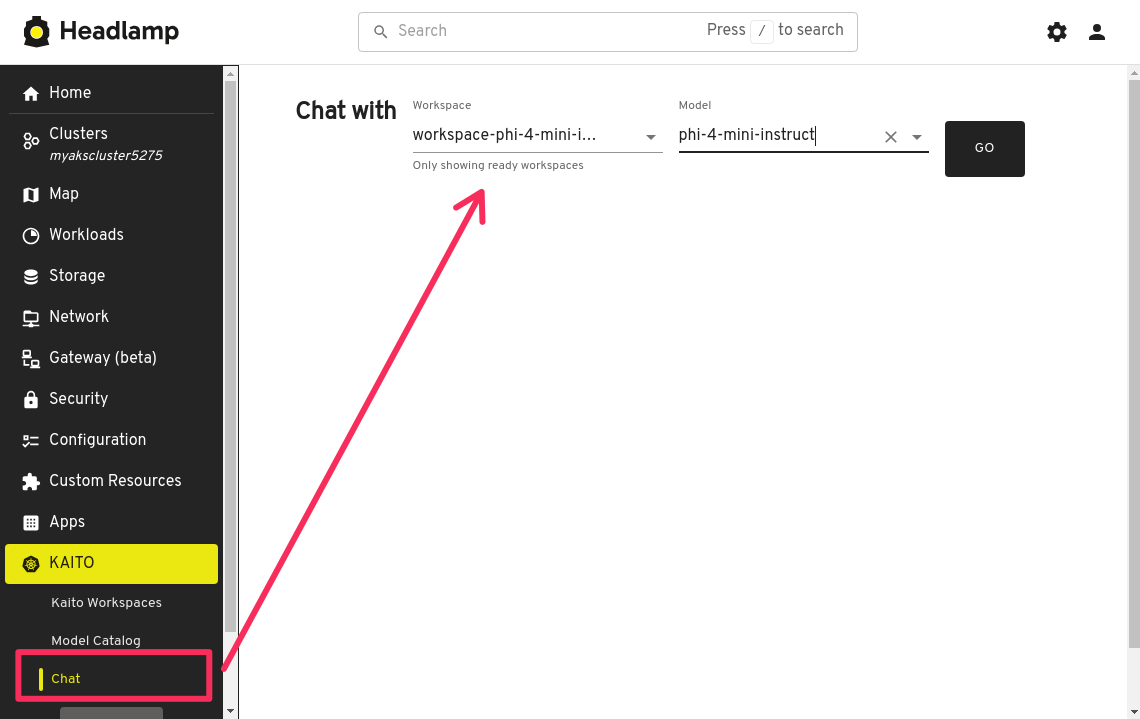
Once the workspace is ready, click on the Chat menu item. A new panel will open that allows you to test the inference endpoint. Select the Workspace and Model using the drop downs, then click the Go button to test. Being able to view workspace logs is useful for debugging and troubleshooting issues with the workspace.
In the chat interface, you have the option to click the settings icon and adjust a few prompt parameters.
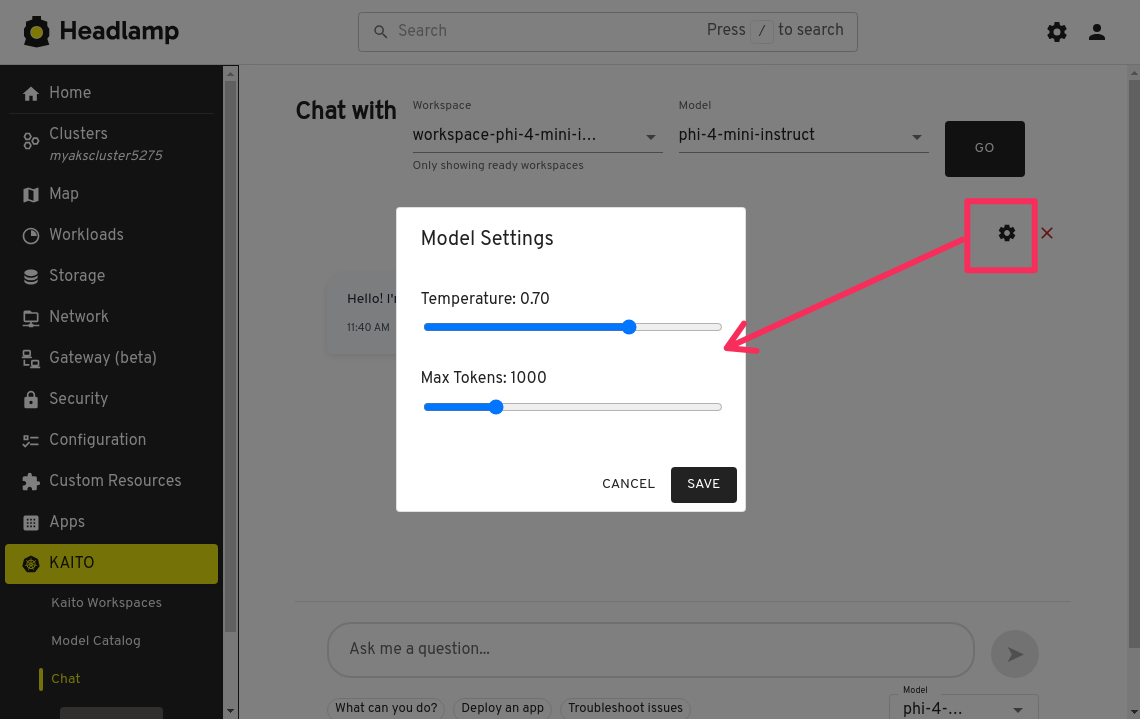
Here you can enter a prompt and configure the following prompt parameters
- Temperature for controlling the randomness of the output
- Max Tokens for controlling the maximum length of the output
- Top P for controlling the diversity of the output
- Top K for controlling the number of tokens to sample from
- Repetition Penalty for controlling the penalty for repeating tokens
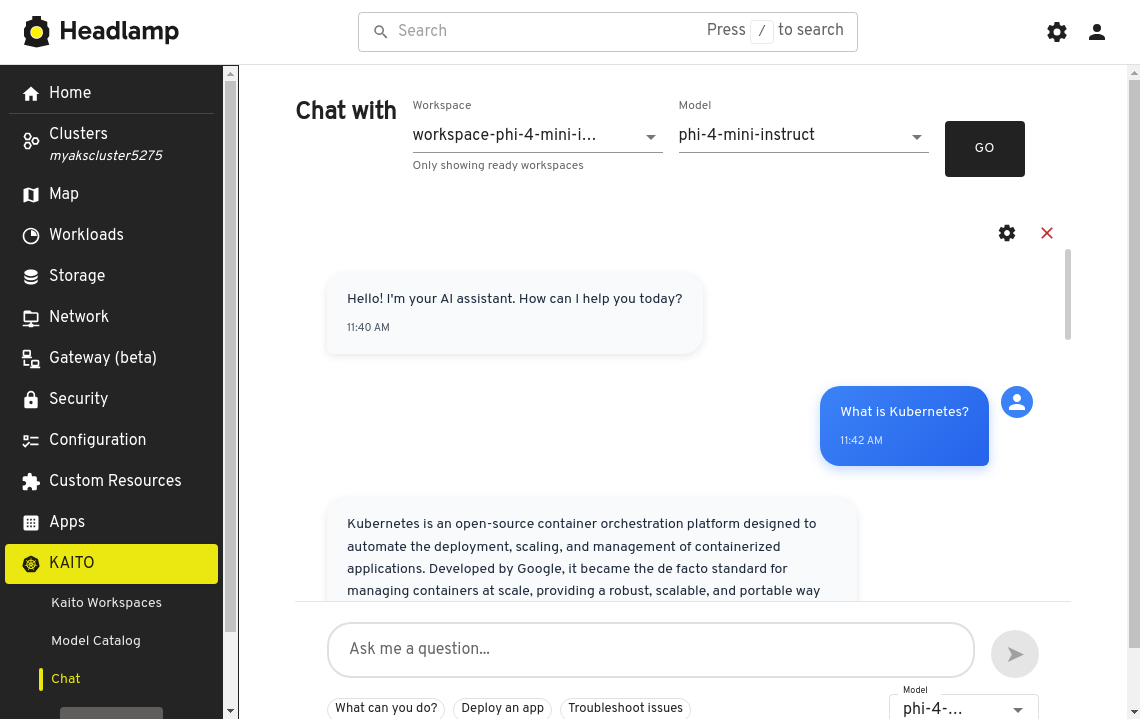
Adjust the prompt parameters as needed then type a prompt into the textbox, then click the Submit Prompt button to send the prompt to model's inference endpoint.
Developing with KAITO
With a workspace deployed, you can now start developing an AI application by interacting with the KAITO workspace endpoint using raw HTTP requests or using a library that supports the OpenAI API. Rather than writing code from scratch, let's download a small sample Python code that uses the Chainlit library to create interactive chat applications using Python.
Download sample code
Open the VS Code terminal then run the following command to create a new directory for the project.
mkdir sampleapp
cd sampleapp
Using curl, download the sample code hosted in the KAITO GitHub repository and save the file as main.py.
curl -o main.py https://raw.githubusercontent.com/kaito-project/kaito/refs/heads/main/demo/inferenceUI/chainlit_openai.py
Open file in VS Code using the following command and familiarize yourself with the code.
code main.py
Since we downloaded the file from the internet, you may be presented with a warning message indicating that the file is untrusted. The file can be trusted 😉 so click the Open button to open the file.
The sample code uses the openai library to interact with the vLLM server which is serving the model. It uses the AsyncOpenAI class to create an OpenAI client for sending requests. The WORKSPACE_SERVICE_URL environment variable is used to specify the URL of the KAITO workspace. This is the only external variable that you need to set to run the code.
The sample code also uses the chainlit library to create a web UI for the application. When the Chainlit app starts, it will call the start_chat function to retrieve the list of models serviced by the vLLM server and select the first model. The main function is called when a message is submitted from the web UI. It builds a messages request object in a specific format the model can understand, which is setting the context and passing in the query from the web UI as a user message to send to the inference server. The settings dictionary near the top of the file is used to configure the prompt parameters and sent as part of the request, like how you configured the prompt parameters in the VS Code Manage KAITO Deployments tab. From there, the Completions API is used to send the message to the model and stream the response back to the web UI. As each part of the stream is received, it updates the web UI to display the partial response until the full response is received.
Port-forward the workspace service
The Chainlit app needs to connect directly to the KAITO workspace service. The service runs as an internal service via ClusterIP which means it is not accessible from outside the cluster. But you can access it from your local machine when using the Kubernetes port forwarding command.
Rather than using the kubectl port-forward command, let's use the Headlamp application to port-forward the workspace service.
In the Headlamp application, click on the Network tab in the left sidebar. In the list of Services, find the workspace-phi-3-5-mini-instruct service and click on it.
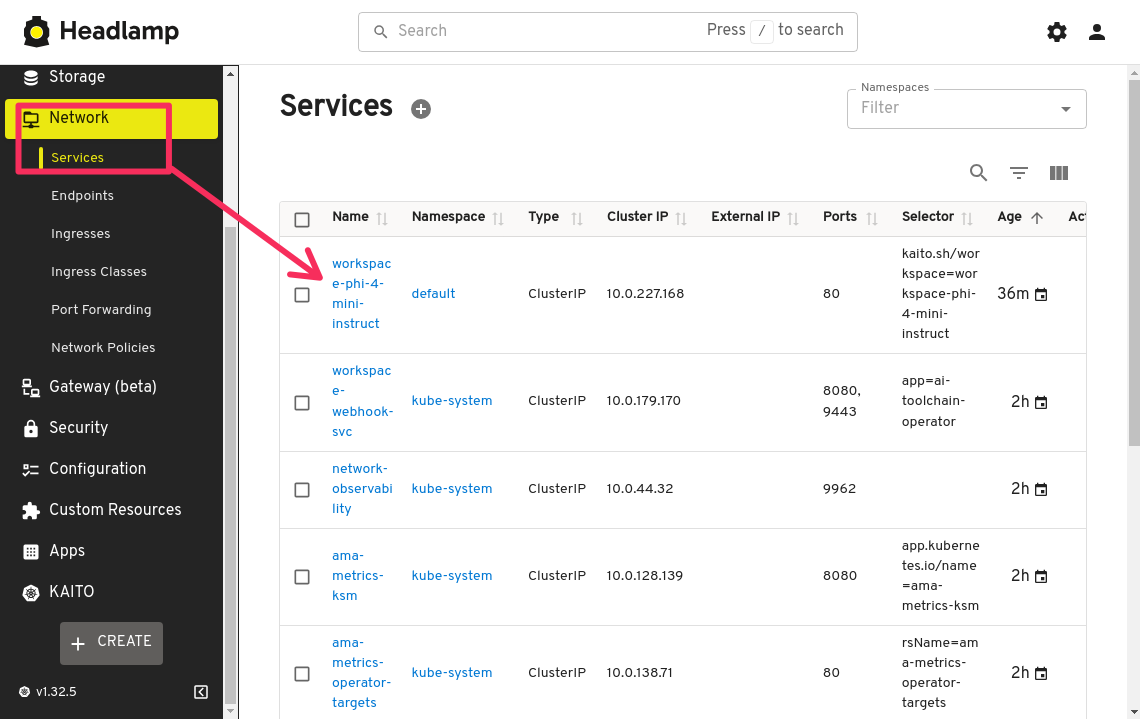
In the service details page, click on the Forward port button
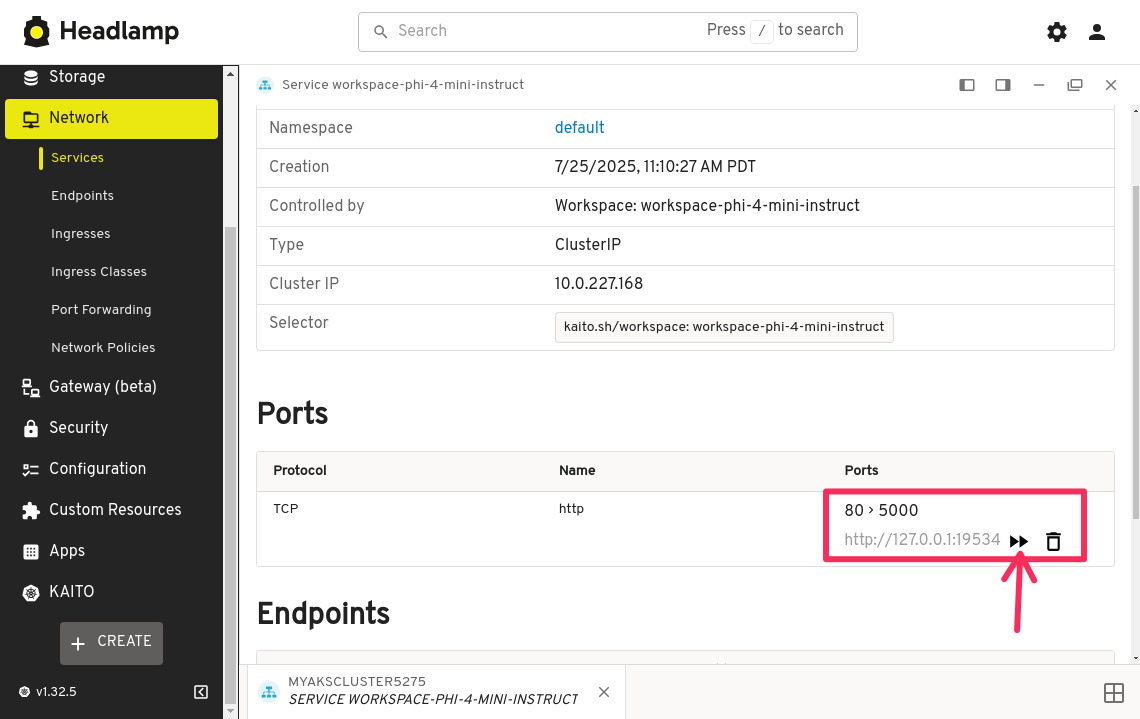
Make a note of the random port that is assigned to the service. This is the port that you will use to connect to the KAITO workspace.
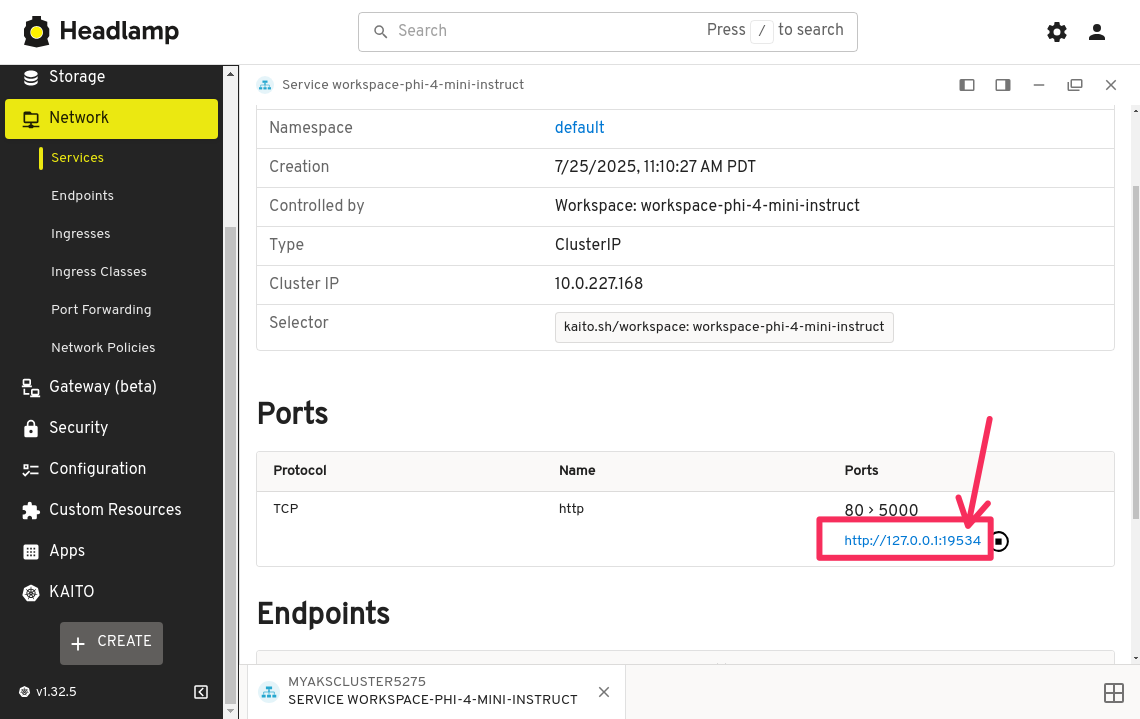
Keep this port forwarded as you will need it for the remainder of the workshop.
Configure the environment variable
Remember that the code looks for the WORKSPACE_SERVICE_URL environment variable to connect to the KAITO workspace.
Go back to your terminal in VS Code and run the following command to create a .env file and set the WORKSPACE_SERVICE_URL to point to the port-forwarded service.
echo "WORKSPACE_SERVICE_URL=http://127.0.0.1:19534/" > .env
The port number 19534 is what was randomly assigned to the service in the previous step. Make sure to replace this with the port number that was assigned to your service.
Install dependencies
As you saw in the code, the sample app relies on a few Python packages to run. You could install them using pip but let's use a new tool called uv to manage the dependencies. uv is a command line tool for managing Python package dependencies and projects and a good alternative to pip as it runs fast and has the ability to manage projects, environments, and dependencies within a single tool.
Run the following command to initialize a new uv project.
uv init
Add the following dependencies to the uv project. The chainlit package is used to create the web UI, pydantic is used for data validation, requests is used to make HTTP requests, and openai is used to interact with the vLLM server.
uv add chainlit pydantic==2.11.3 requests openai
Next, run the following command to start the Chainlit app and set the environment variable for the WORKSPACE_SERVICE_URL by passing in the .env file using the --env-file option.
uv run --env-file=.env chainlit run main.py
This will start a local web server, open a web browser and navigate to http://localhost:8000.
In the Chainlit app, enter a prompt in the text box and click the submit button to send the prompt to the KAITO workspace. The response will be displayed in the web UI.
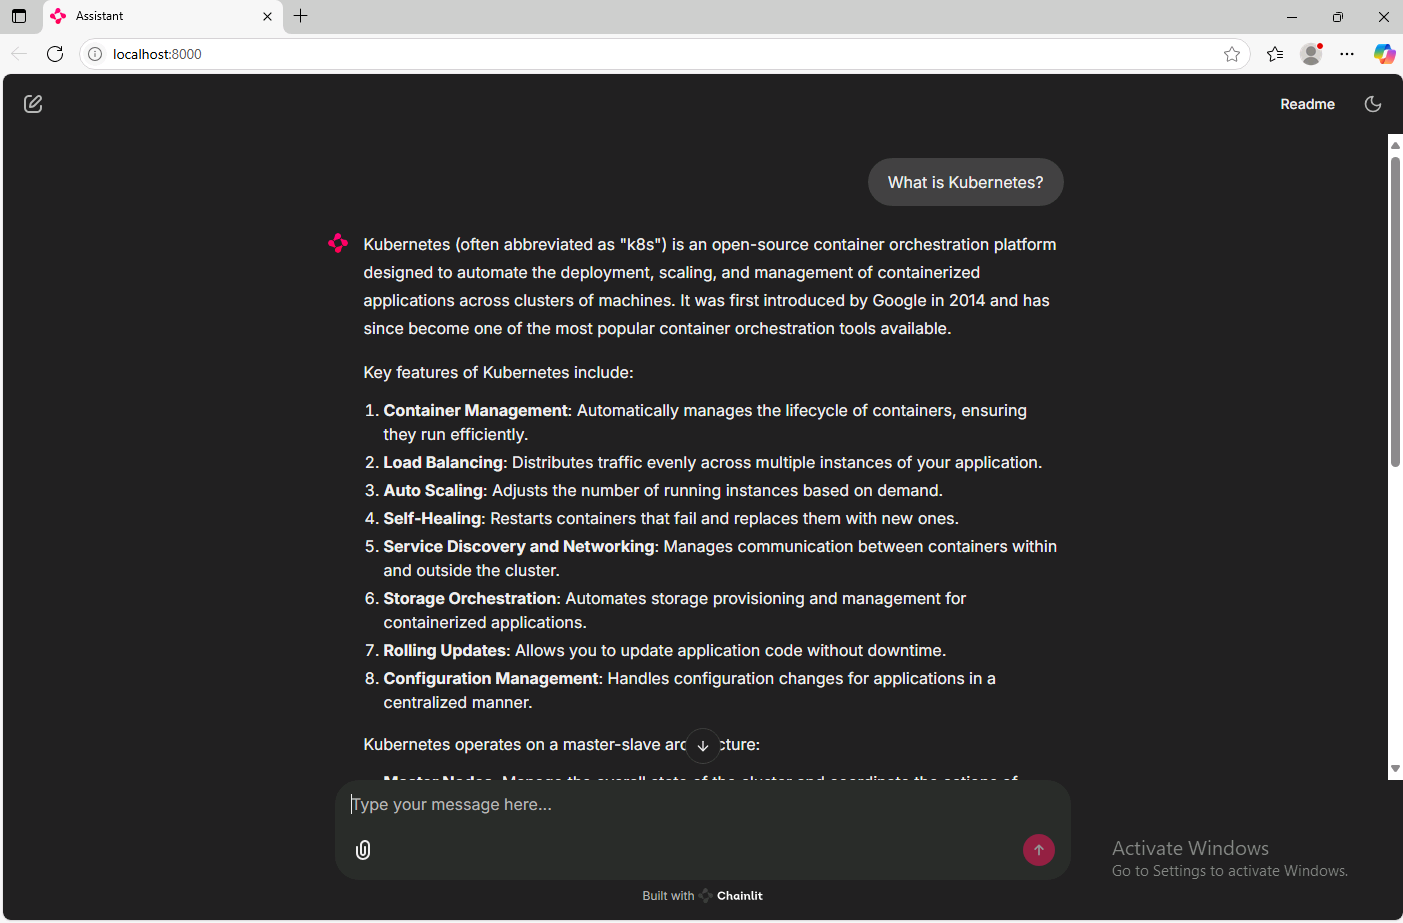
As you can see, developing against the KAITO workspace is relatively simple. Using the OpenAI library to send requests makes it compatible with any existing codebase that uses the OpenAI API.
Press Ctrl+c to stop the Chainlit app.
Monitoring KAITO workspaces
With workspaces being served using the vLLM runtime, you can monitor the performance of the KAITO workspace using the metrics emitted by the vLLM server. The vLLM server emits metrics in the Prometheus format which makes it very easy to be scraped by Prometheus and visualized in Grafana.
To view the metrics that is emitted by the vLLM server, browse to the /metrics endpoint of the workspace service which is http://localhost:19534/metrics.
The port number 19534 is what was randomly assigned to the service in the previous step. Make sure to replace this with the port number that was assigned to your service.
Scrape metrics with Prometheus
To scrape the metrics emitted by the vLLM server, you need to have Prometheus installed in your AKS cluster. This AKS cluster in this lab environment is configured with Azure Managed Prometheus and Azure Managed Grafana configured for monitoring.
With the metrics monitoring configured in the AKS cluster, Prometheus ServiceMonitor and PodMonitor CRDs are installed. You could use either custom resource, but ServiceMonitor would be the preferred option because you can configure it at a higher level and it is easier to manage.
The Azure Managed Prometheus installation comes with special CRDs that use a different API version. The CRDs are installed in the azmonitoring.coreos.com API group. You can find more information about the CRDs in the Azure Managed Prometheus documentation.
Before you deploy the ServiceMonitor, you will need to label the workspace's service so that the ServiceMonitor can identify the service to scrape metrics from.
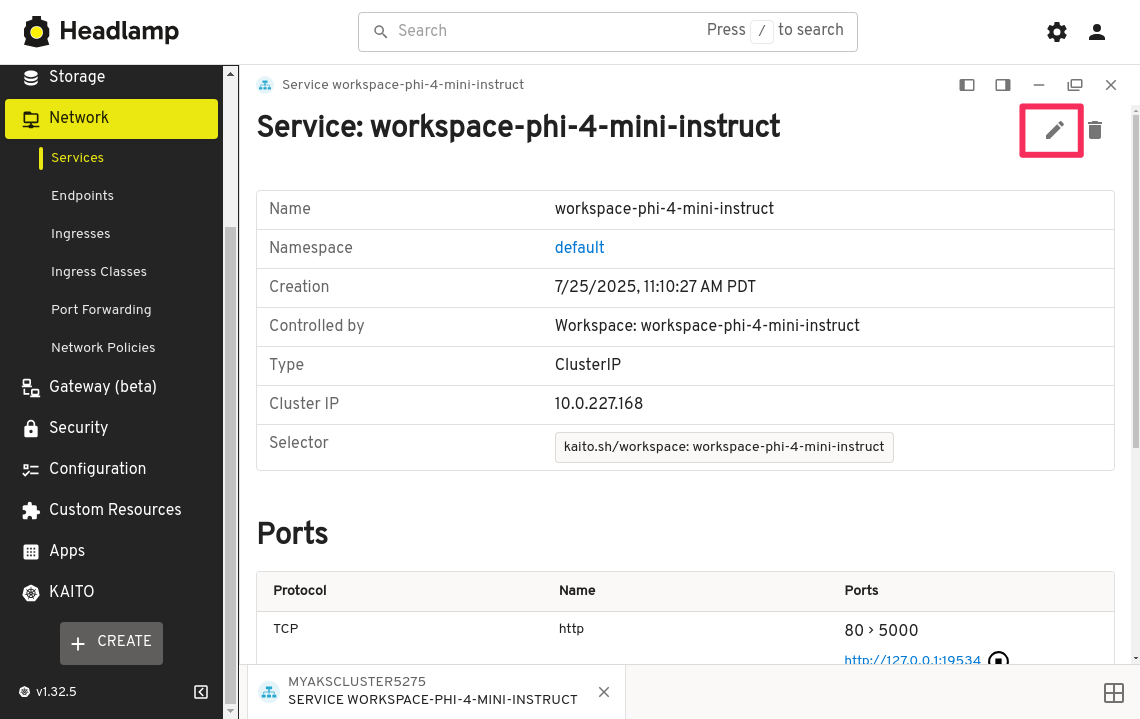
Let's use Headlamp again to label the workspace service. Go back to the Headlamp application and navigate back to the workspace-phi-4-mini-instruct service details page, click on the edit button in the top right corner.
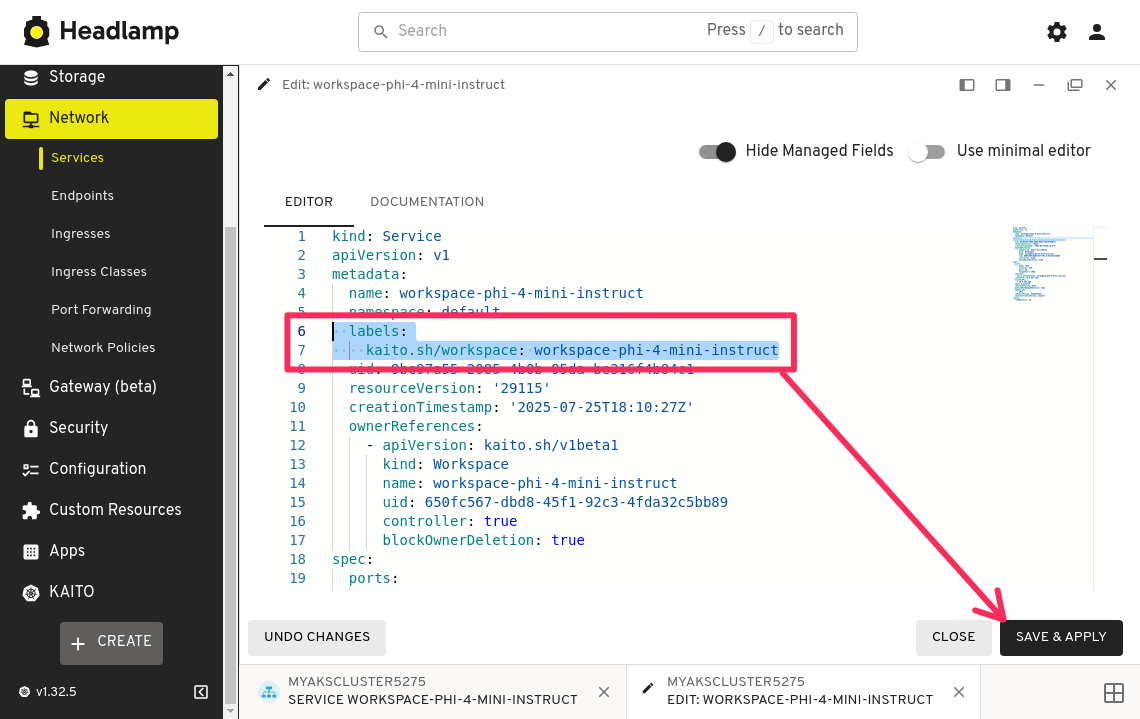
In the YAML editor window, find the namespace field and add a new line below it, then add the following text to label the service, then click the APPLY button.
labels:
  kaito.sh/workspace: workspace-phi-4-mini-instruct
Be careful with the indentation. YAML is very sensitive to indentation and whitespace. Make sure the labels field is at the same level as the namespace field and the kaito.sh/workspace label is indented with two spaces.
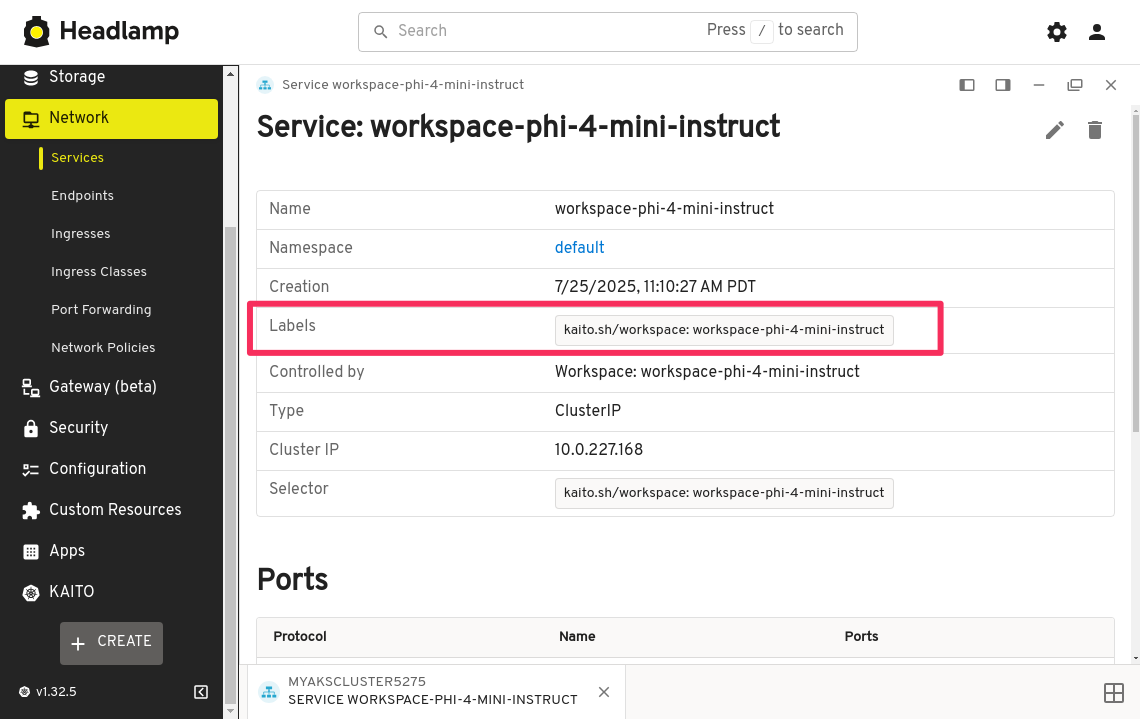
You should see the label added to the service.
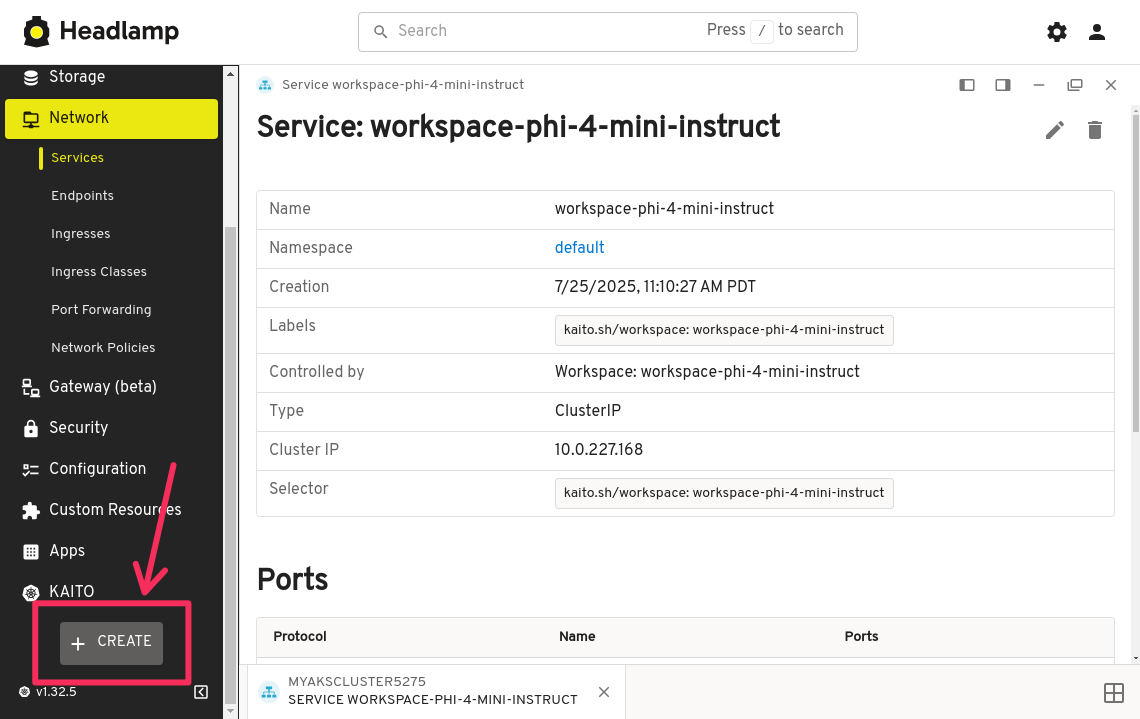
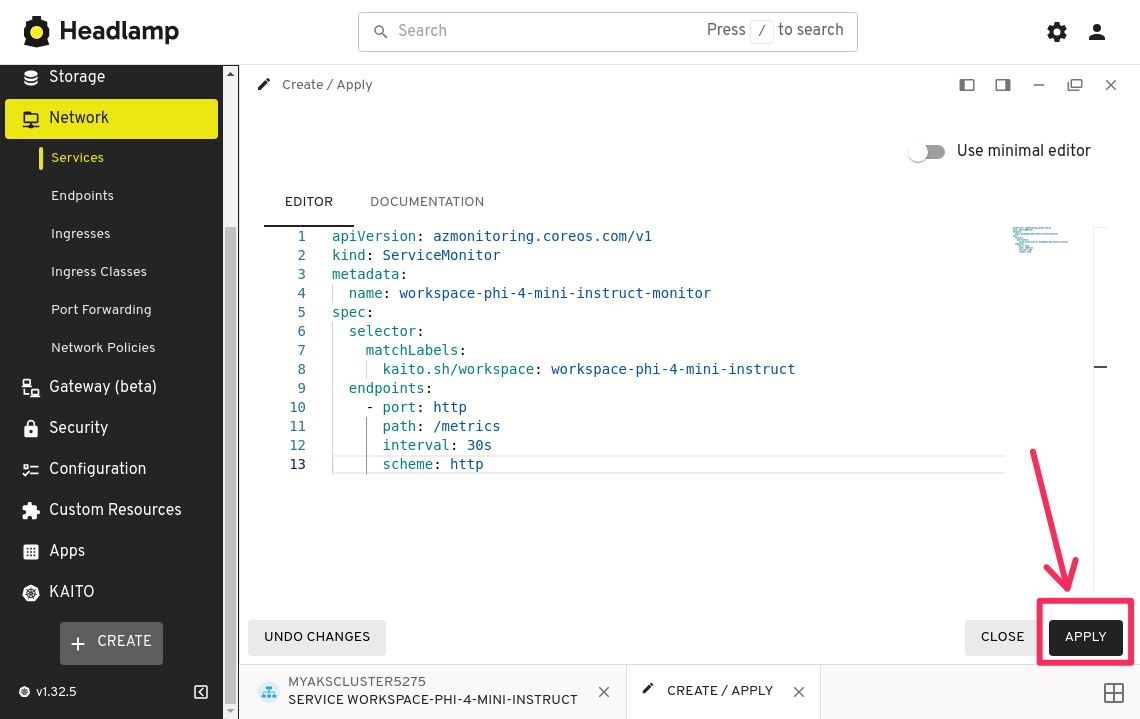
Next, deploy a ServiceMonitor to scrape from the /metrics endpoint. In the bottom left corner of the Headlamp application, click on the CREATE button to create a new resource.
In the YAML editor, copy and paste the following YAML manifest to create a ServiceMonitor resource.
apiVersion: azmonitoring.coreos.com/v1
kind: ServiceMonitor
metadata:
  name: workspace-phi-4-mini-instruct-monitor
spec:
  selector:
    matchLabels:
      kaito.sh/workspace: workspace-phi-4-mini-instruct
  endpoints:
    - port: http
      path: /metrics
      interval: 30s
      scheme: http
Notice the selector field in the ServiceMonitor YAML manifest is used to select the service to scrape metrics from. The matchLabels field is used to match the labels on the service. In this case, we are using the label we just added to the workspace service.
Import vLLM Grafana dashboard
vLLM provides a sample Grafana dashboard that you can use to monitor the performance of the KAITO workspace. You can import this dashboard into Azure Managed Grafana.
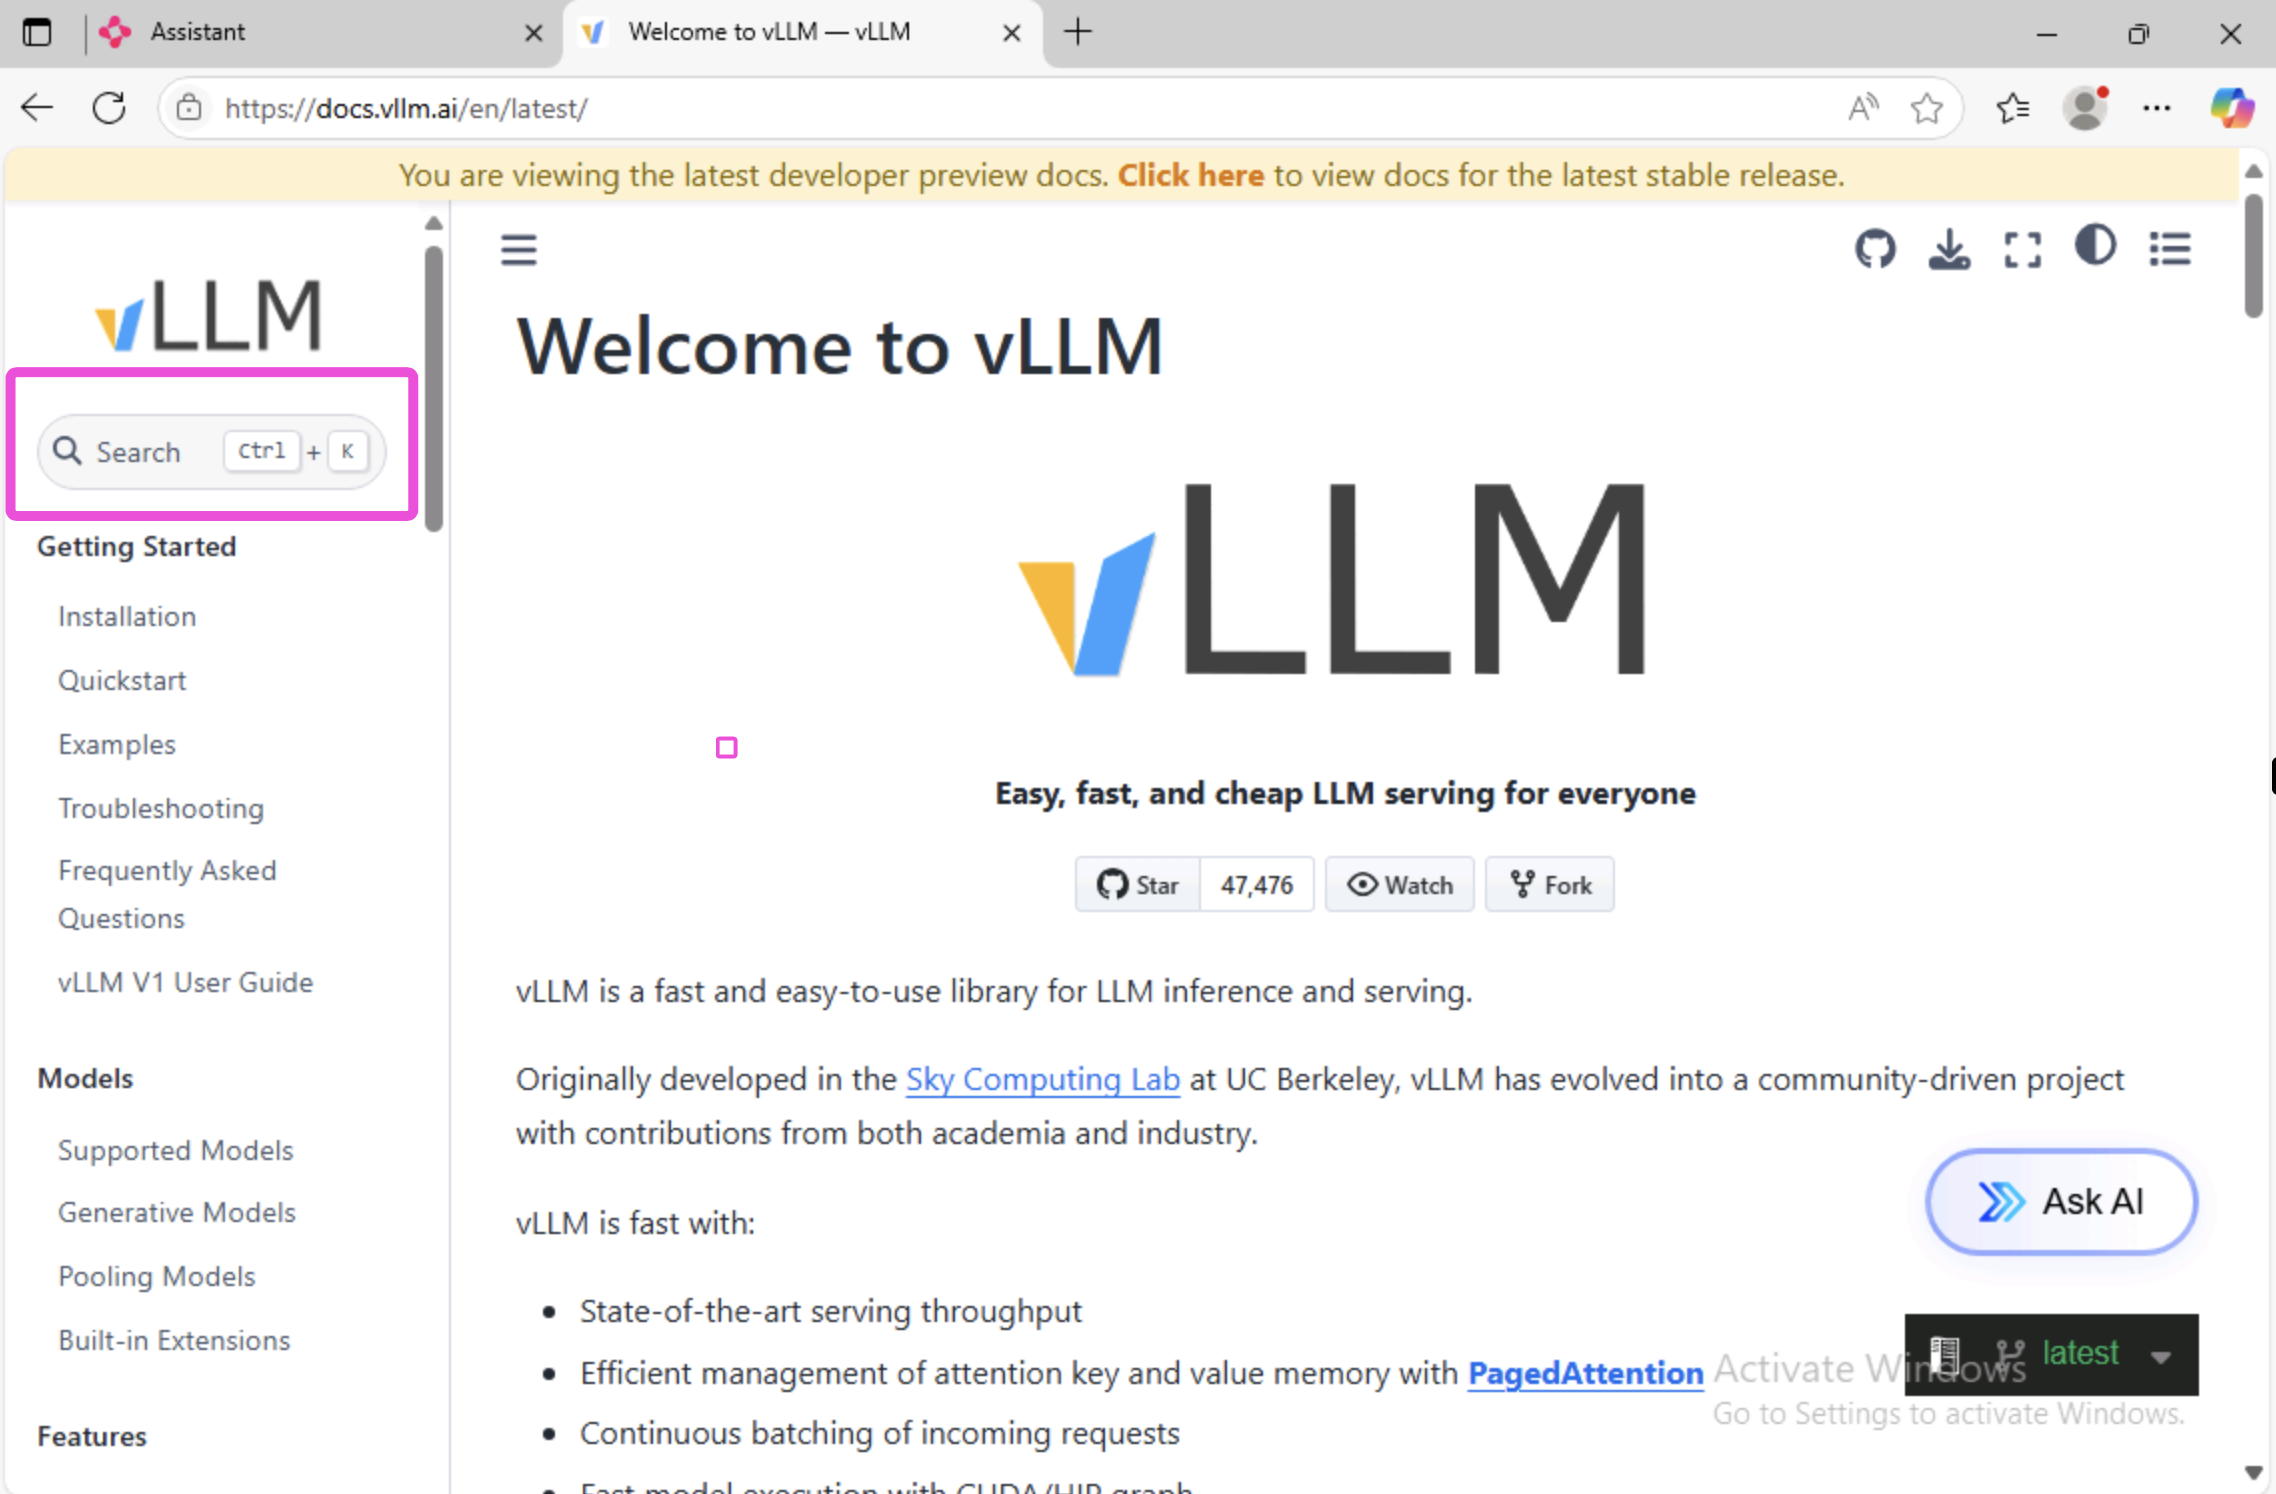
In the web browser, open a new tab and navigate to https://docs.vllm.ai
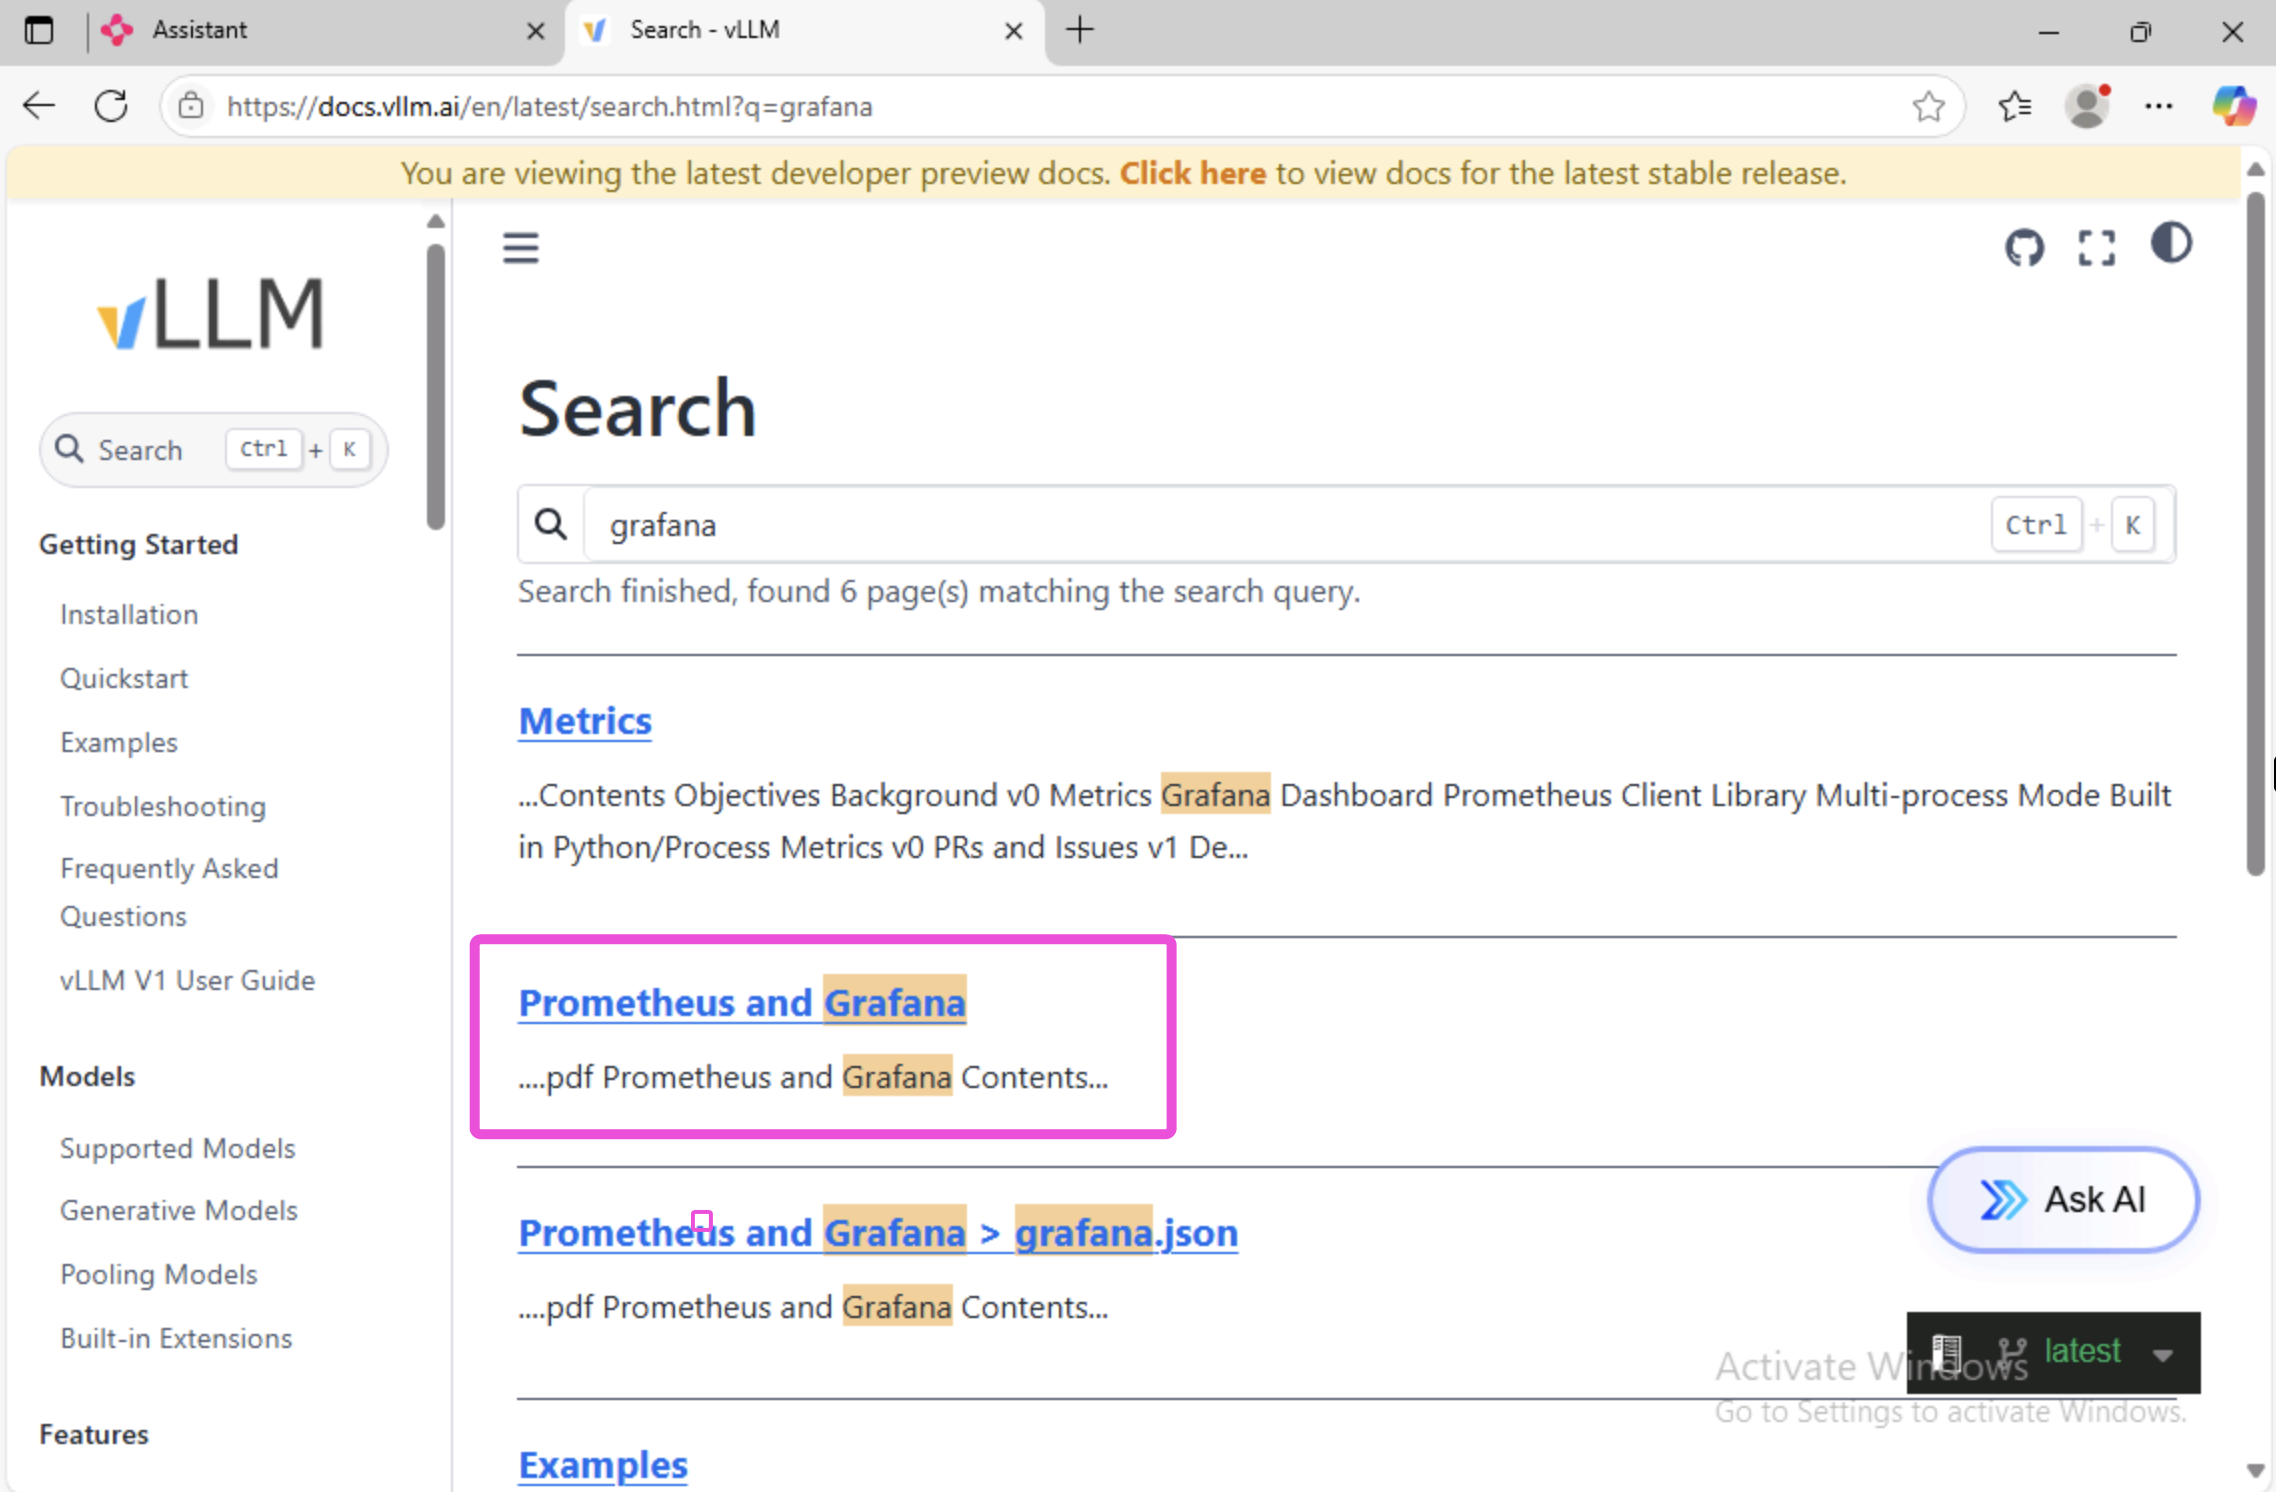
In the vLLM docs site, use the search bar to search for grafana.
In the search results, click on the Prometheus and Grafana link.
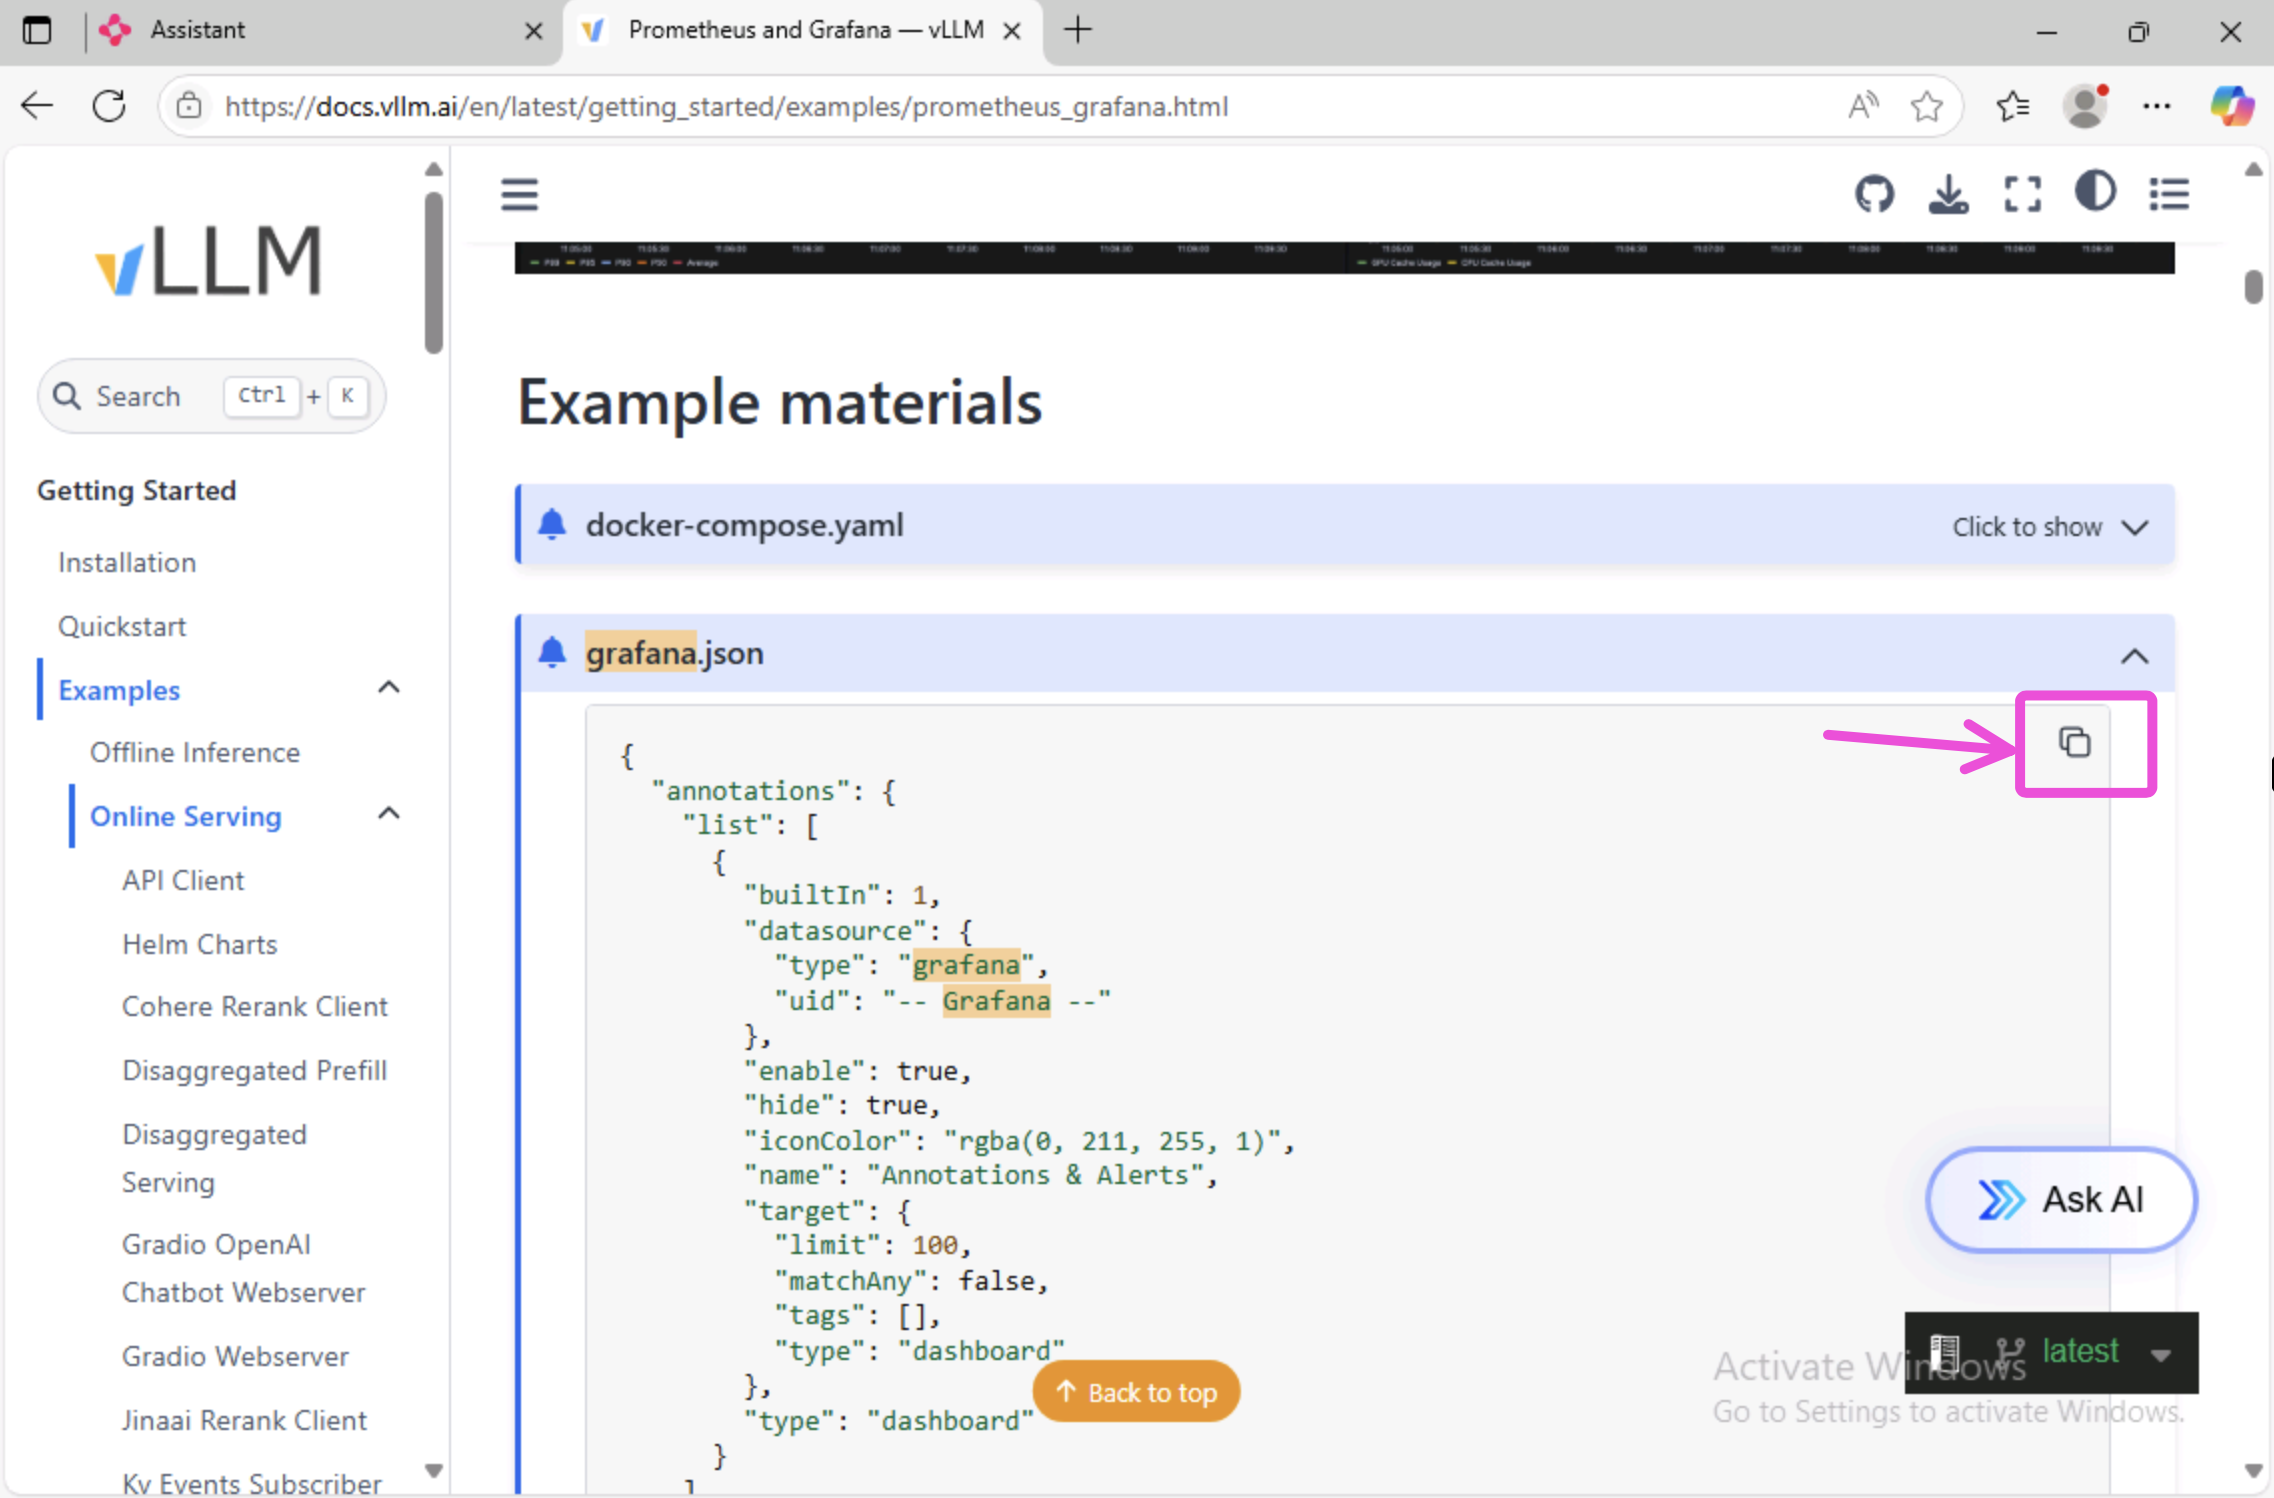
In the Prometheus and Grafana page, scroll down to the Example materials section.
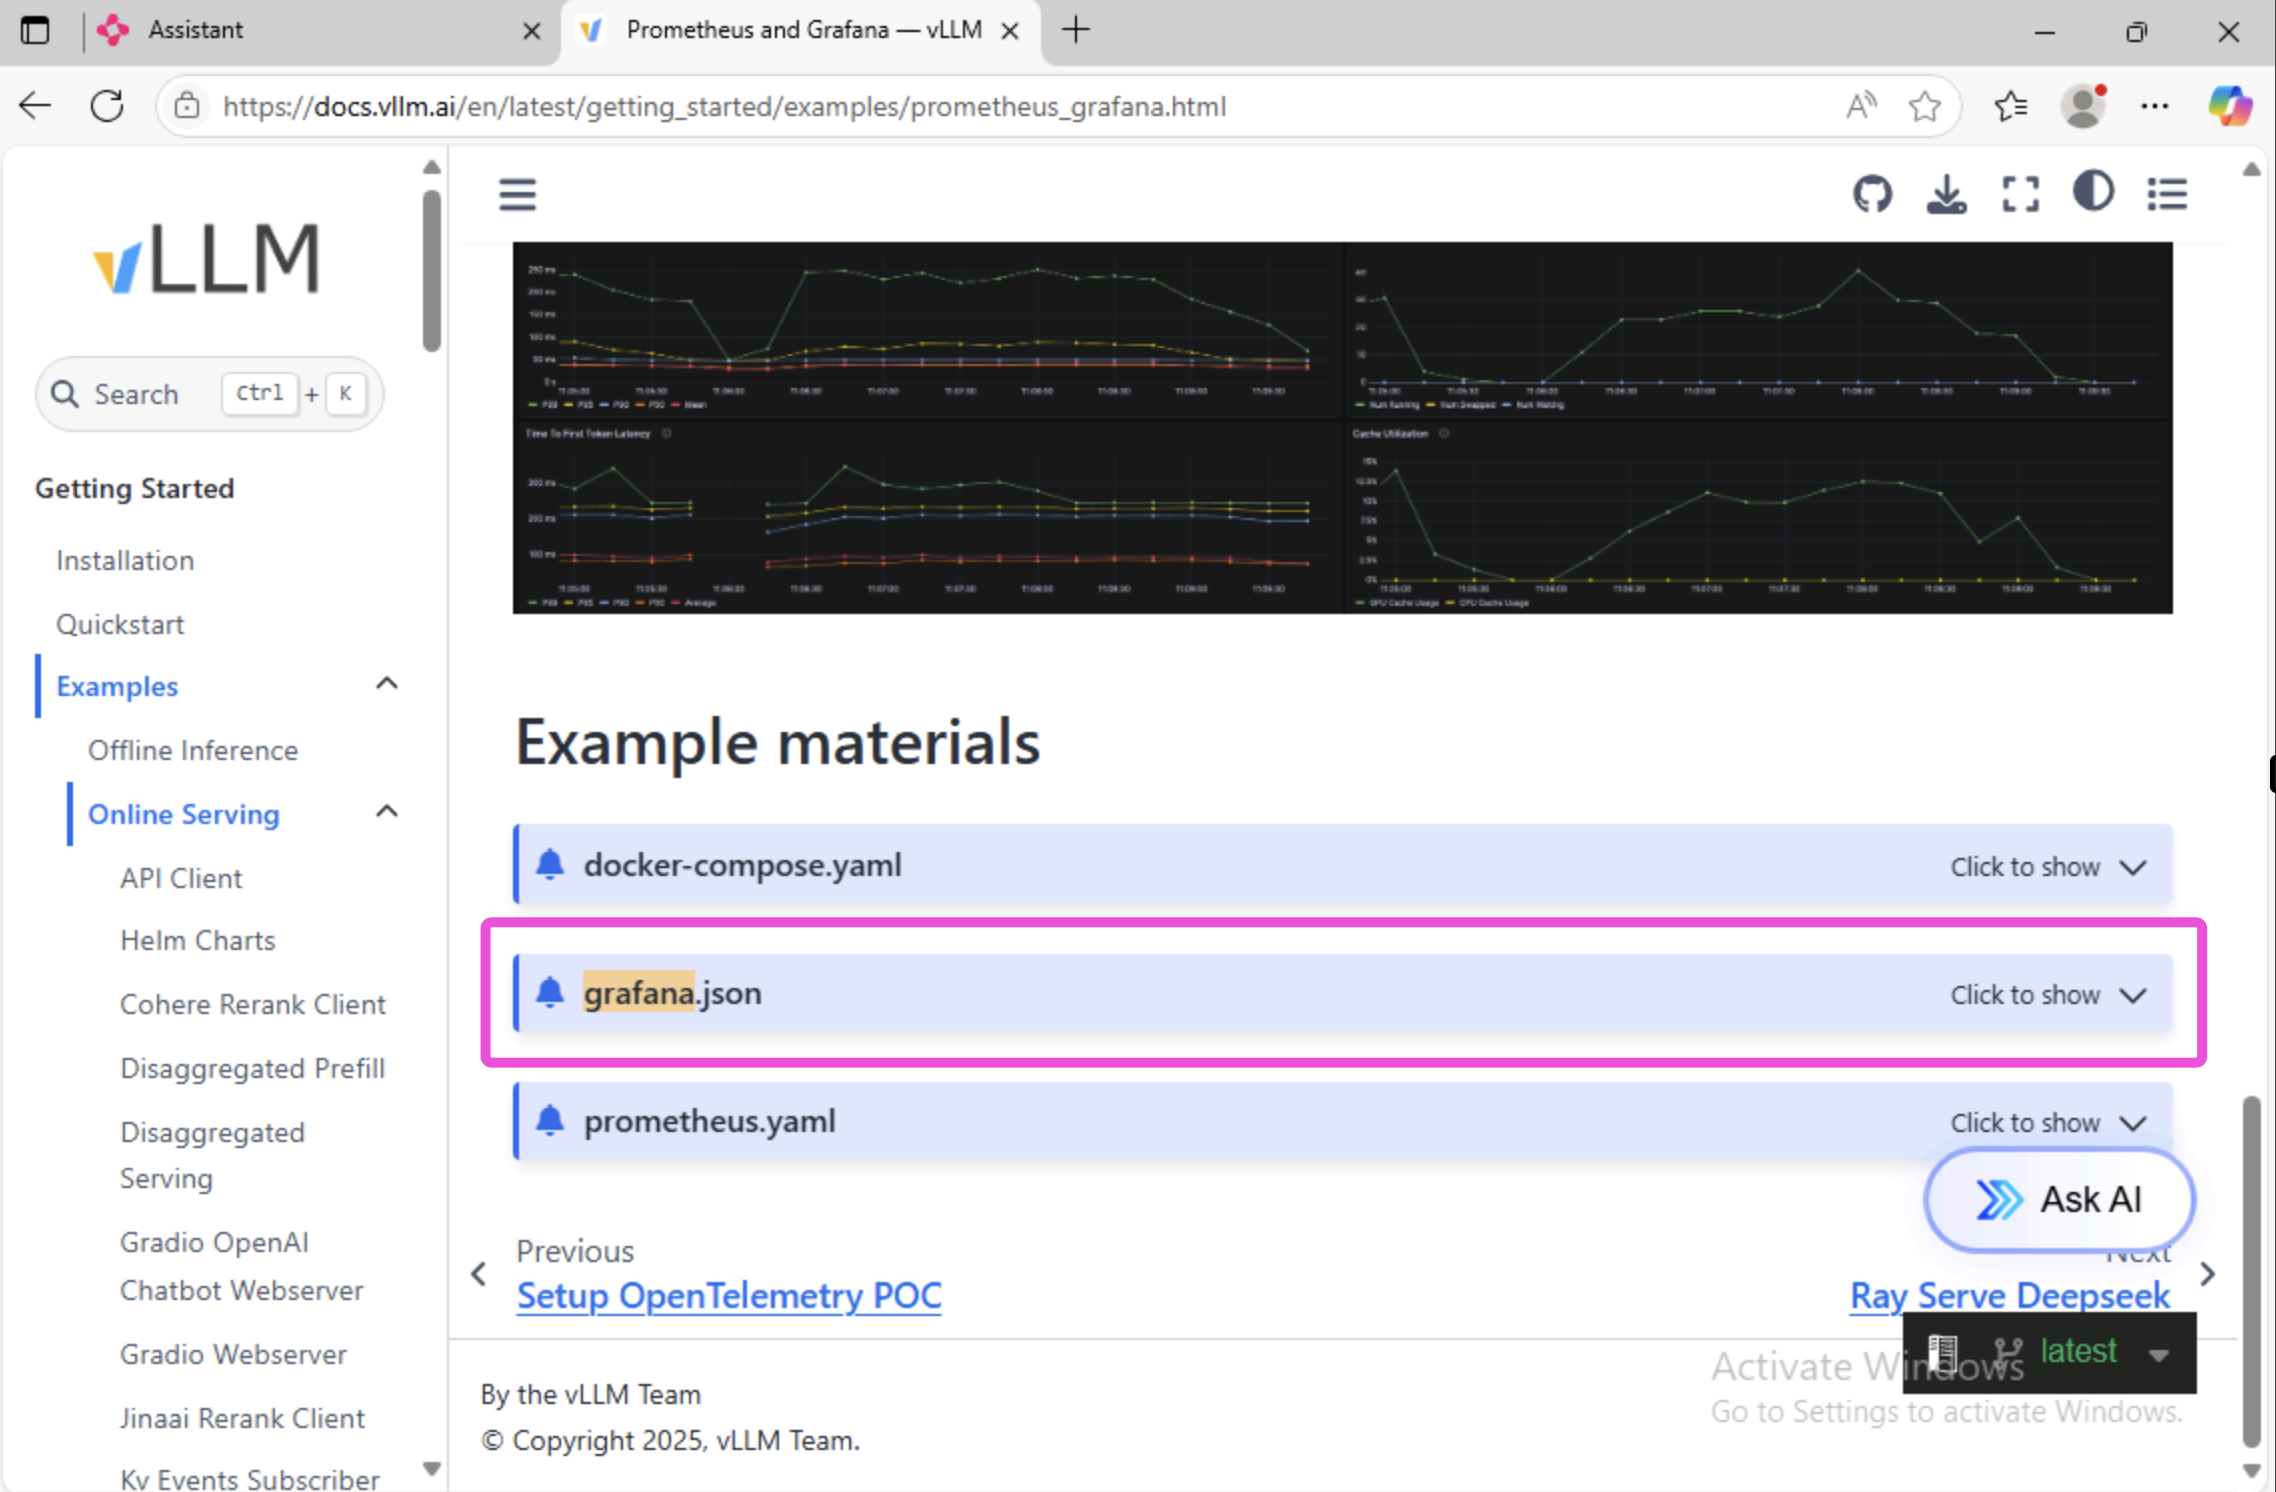
Expand the grafana.json section and click on the copy button to copy the JSON to your clipboard.
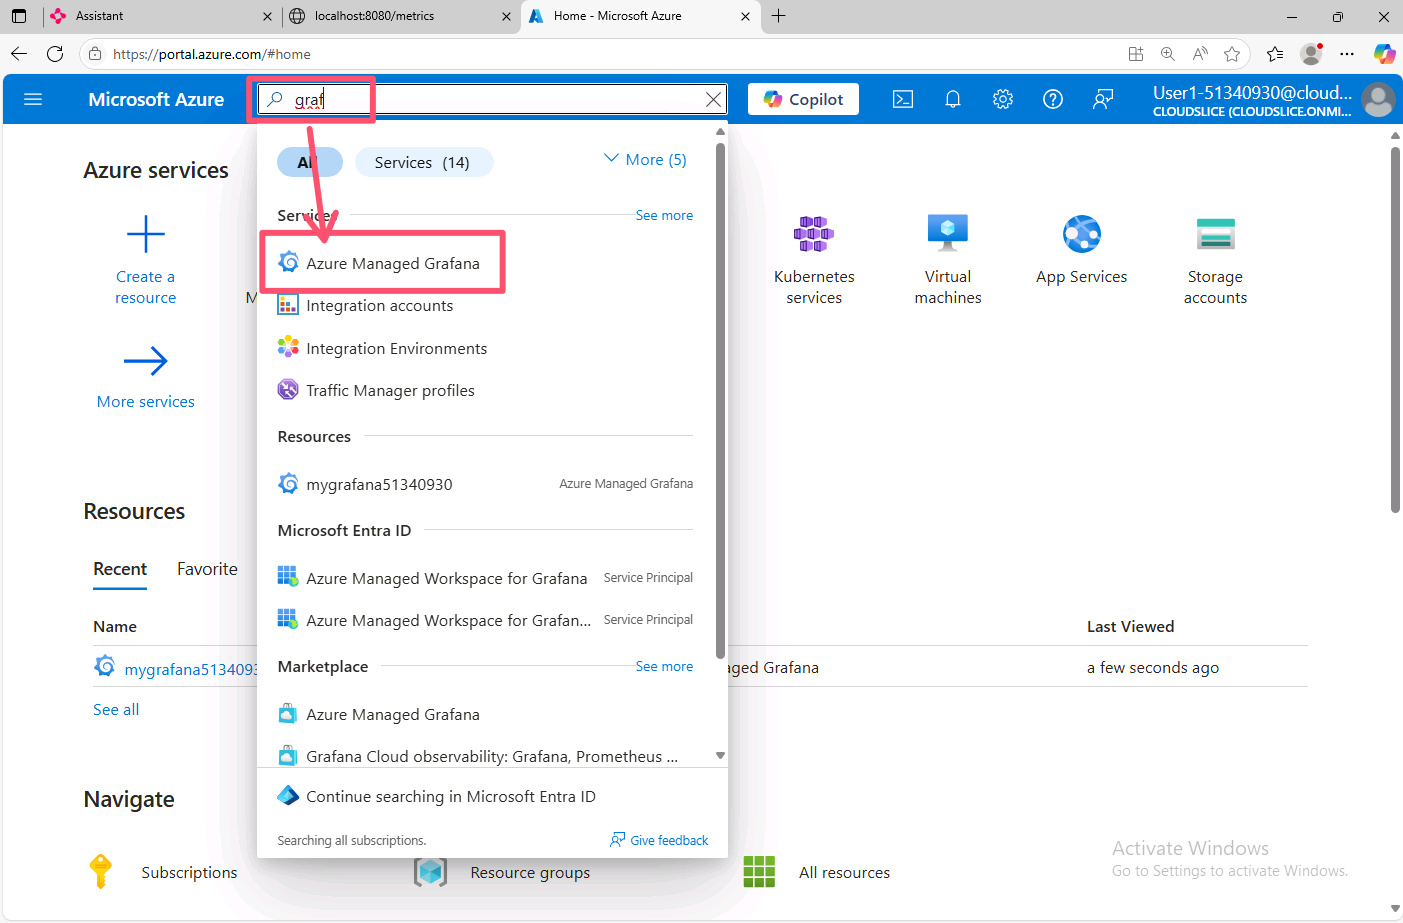
Now you need to import the dashboard into your Azure Managed Grafana instance. Open a new browser tab and navigate to https://portal.azure.com. In the search bar, type grafana and select Azure Managed Grafana.
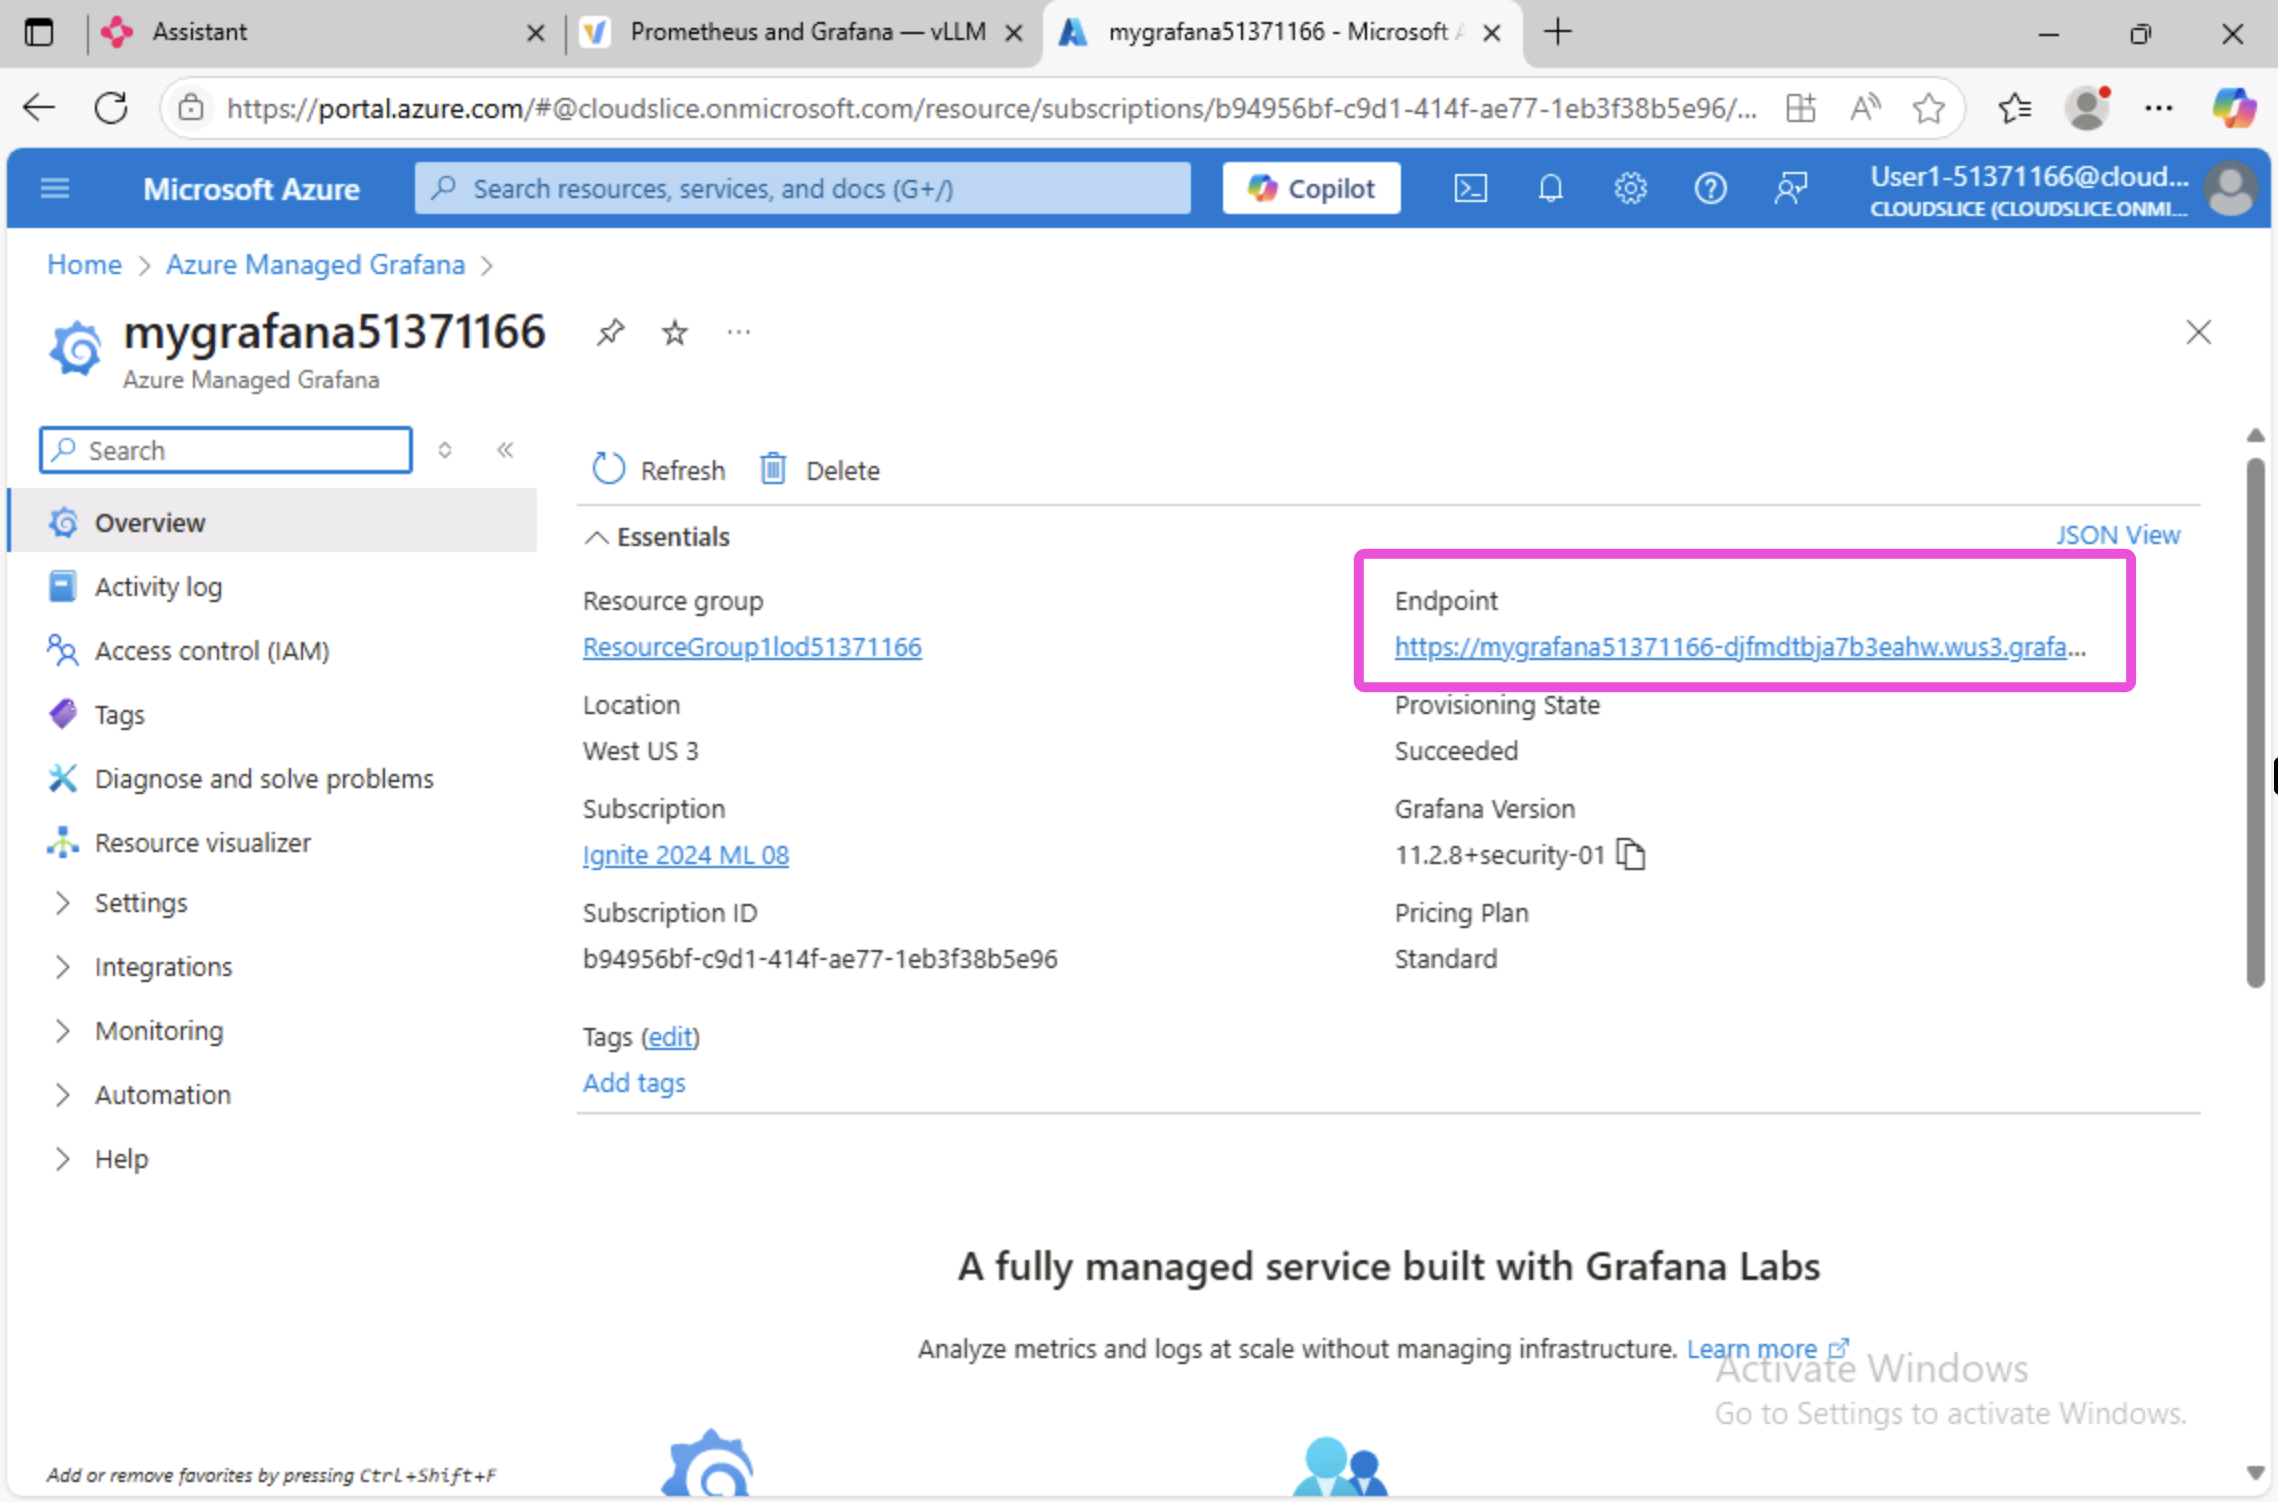
Click on your Azure Managed Grafana instance, then click on the endpoint URL to open the Grafana dashboard.
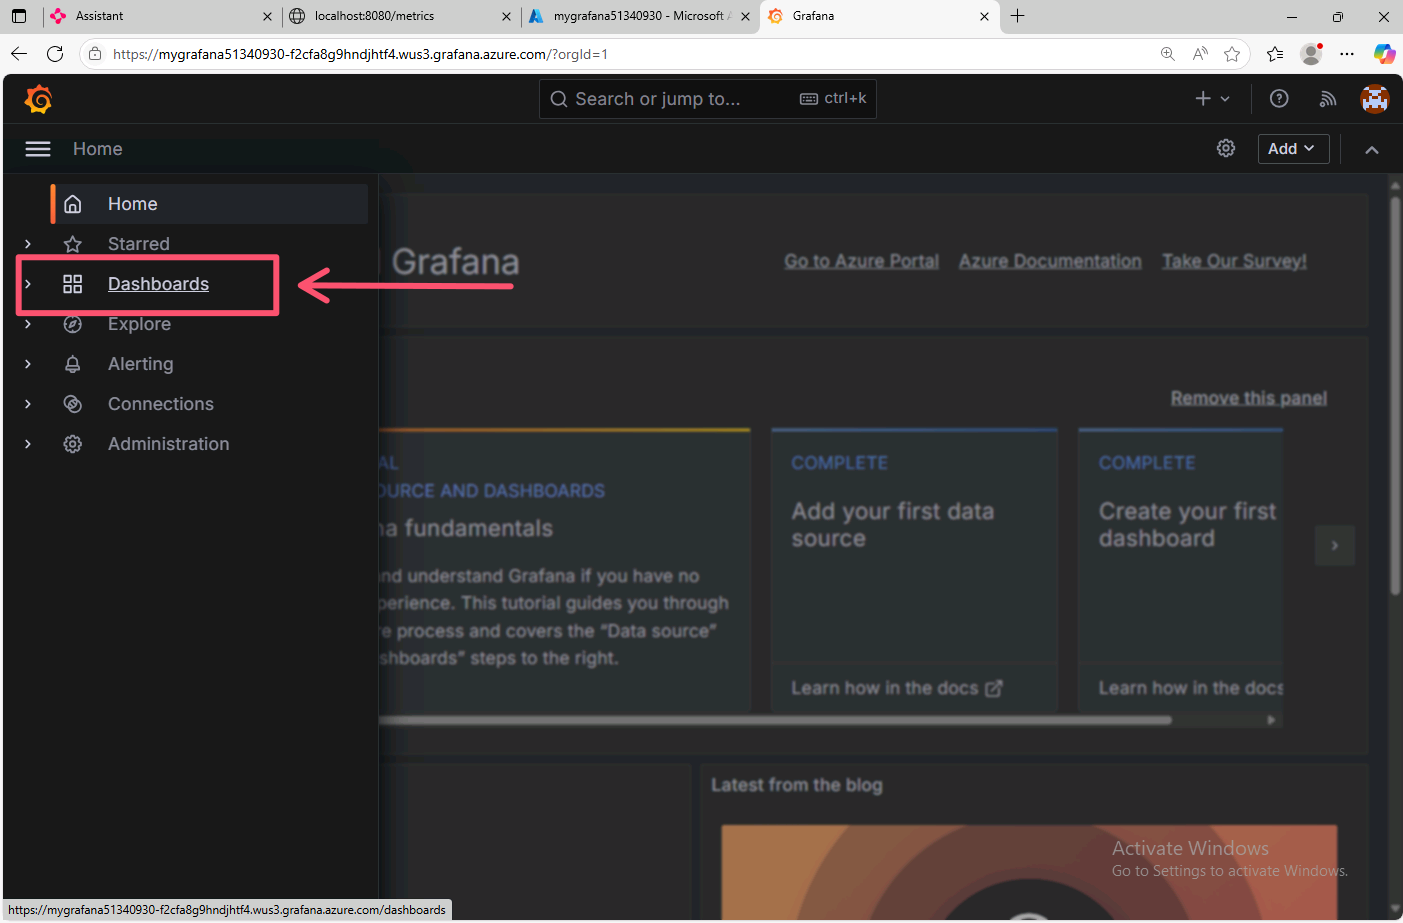
Log into the Grafana dashboard using your Azure credentials, then click on the Dashboards tab on the left side of the screen.
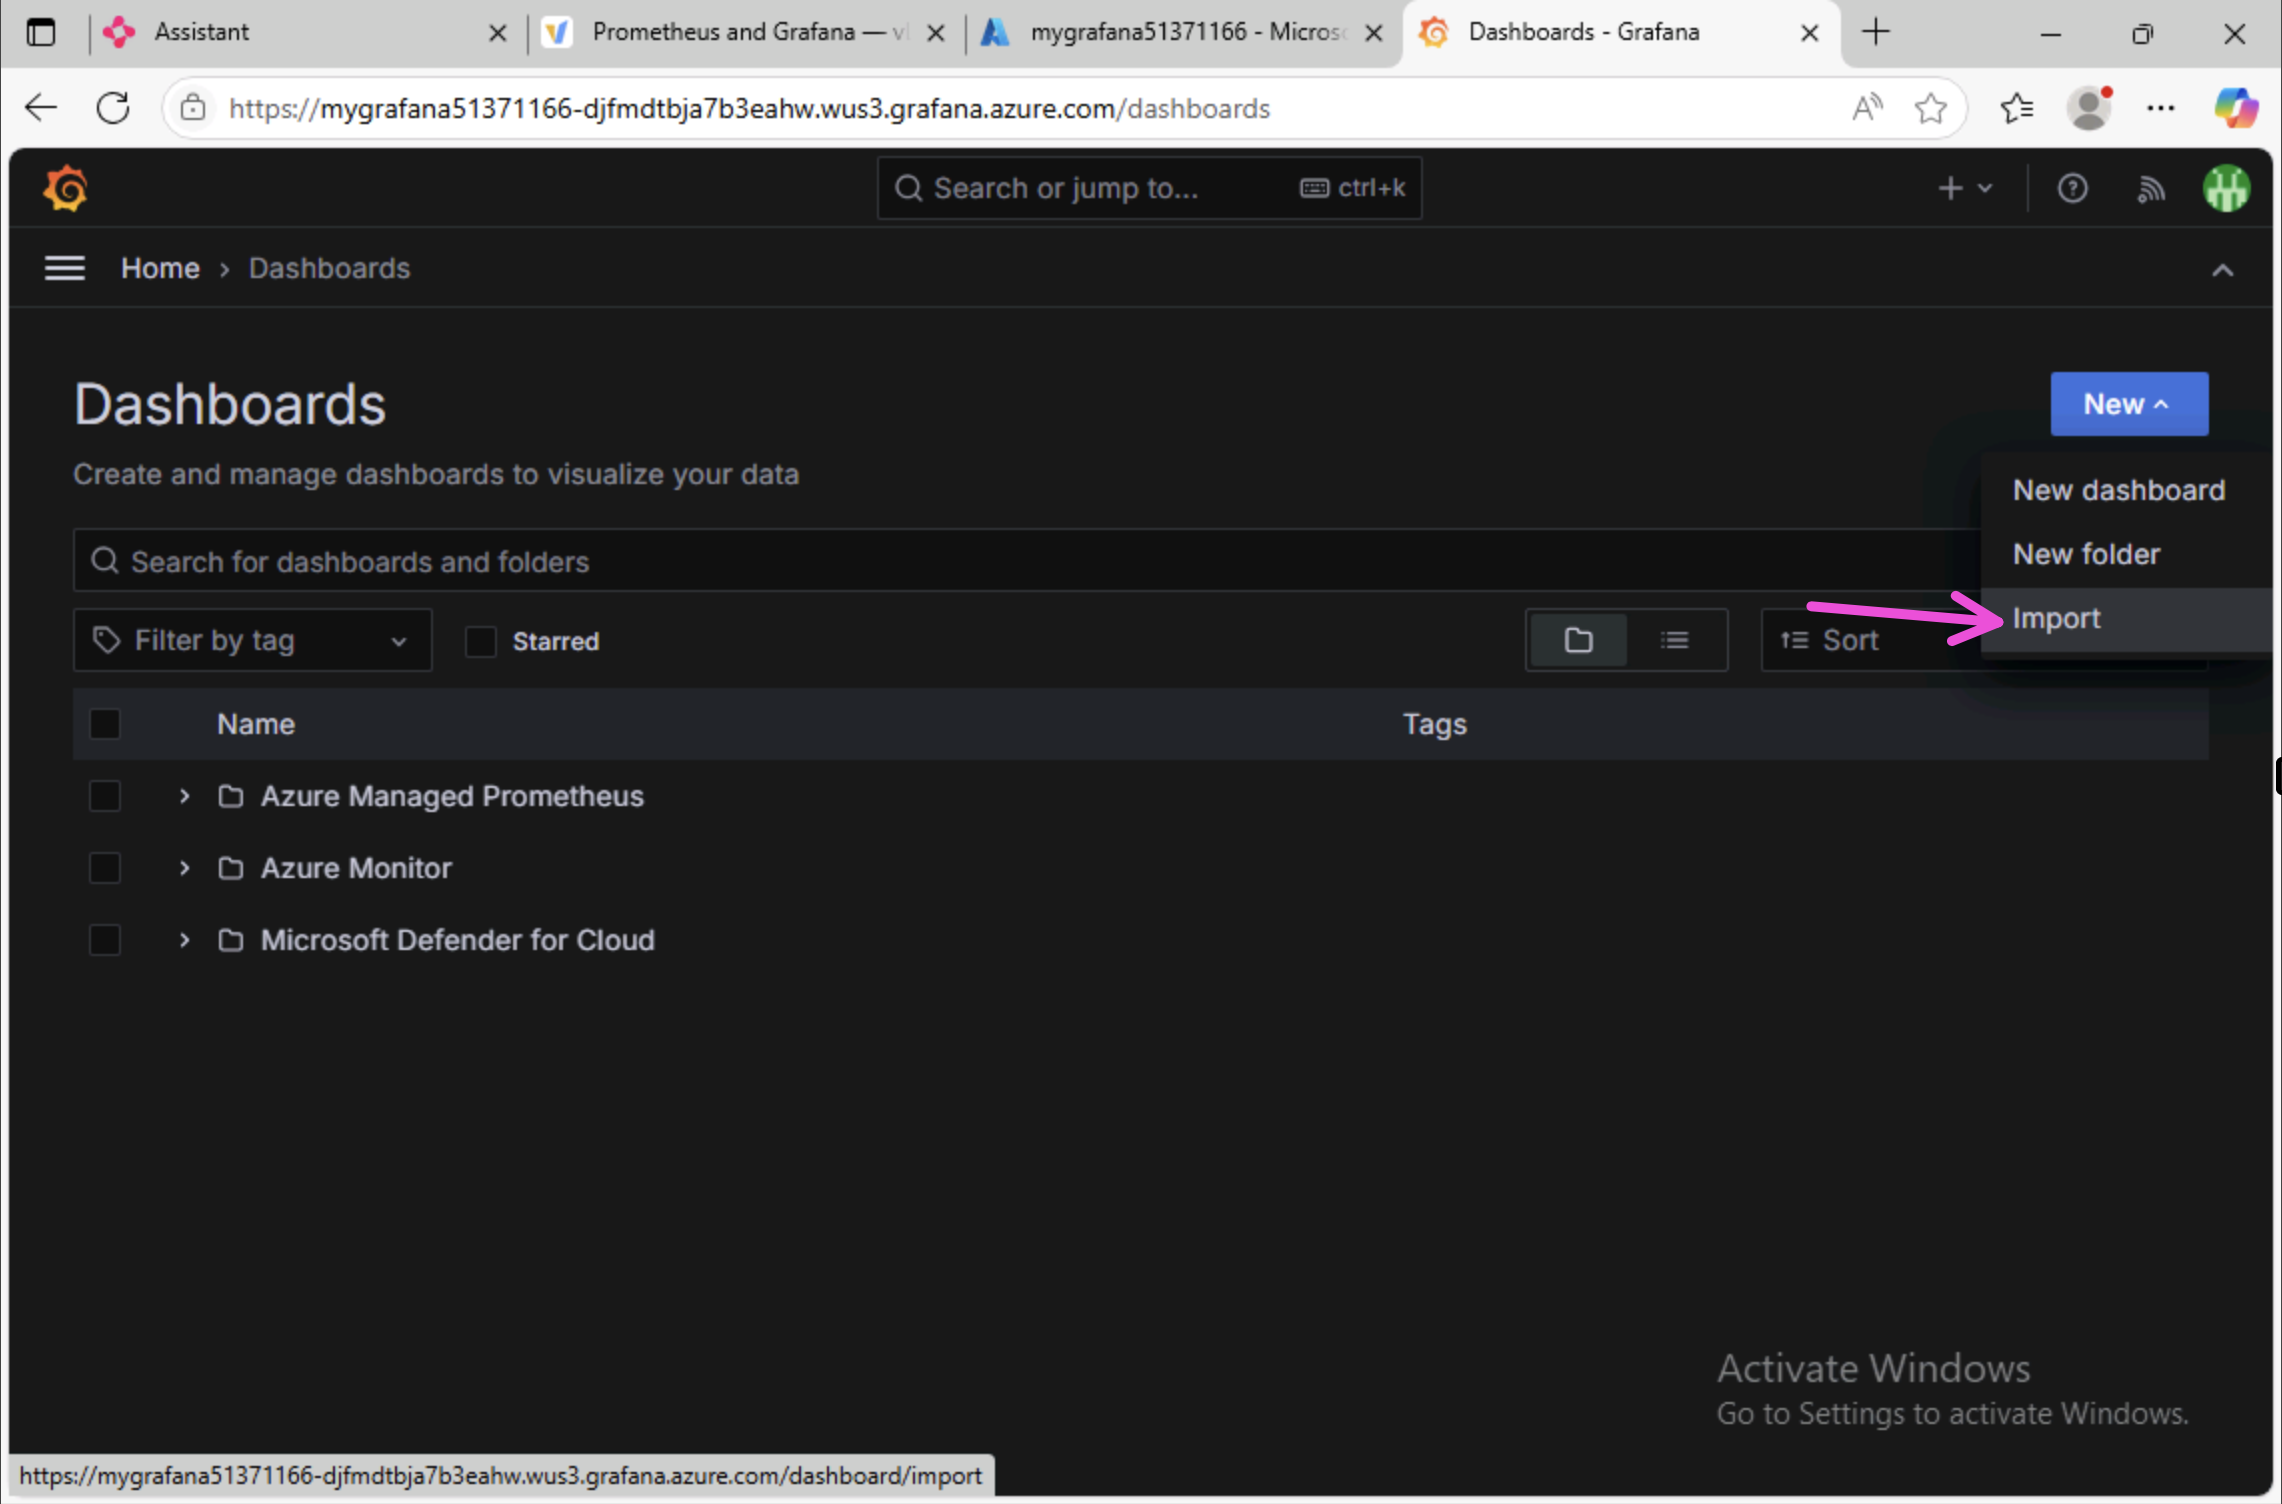
In the Grafana dashboards page, click on the New button in the top right corner, then click on the Import button.
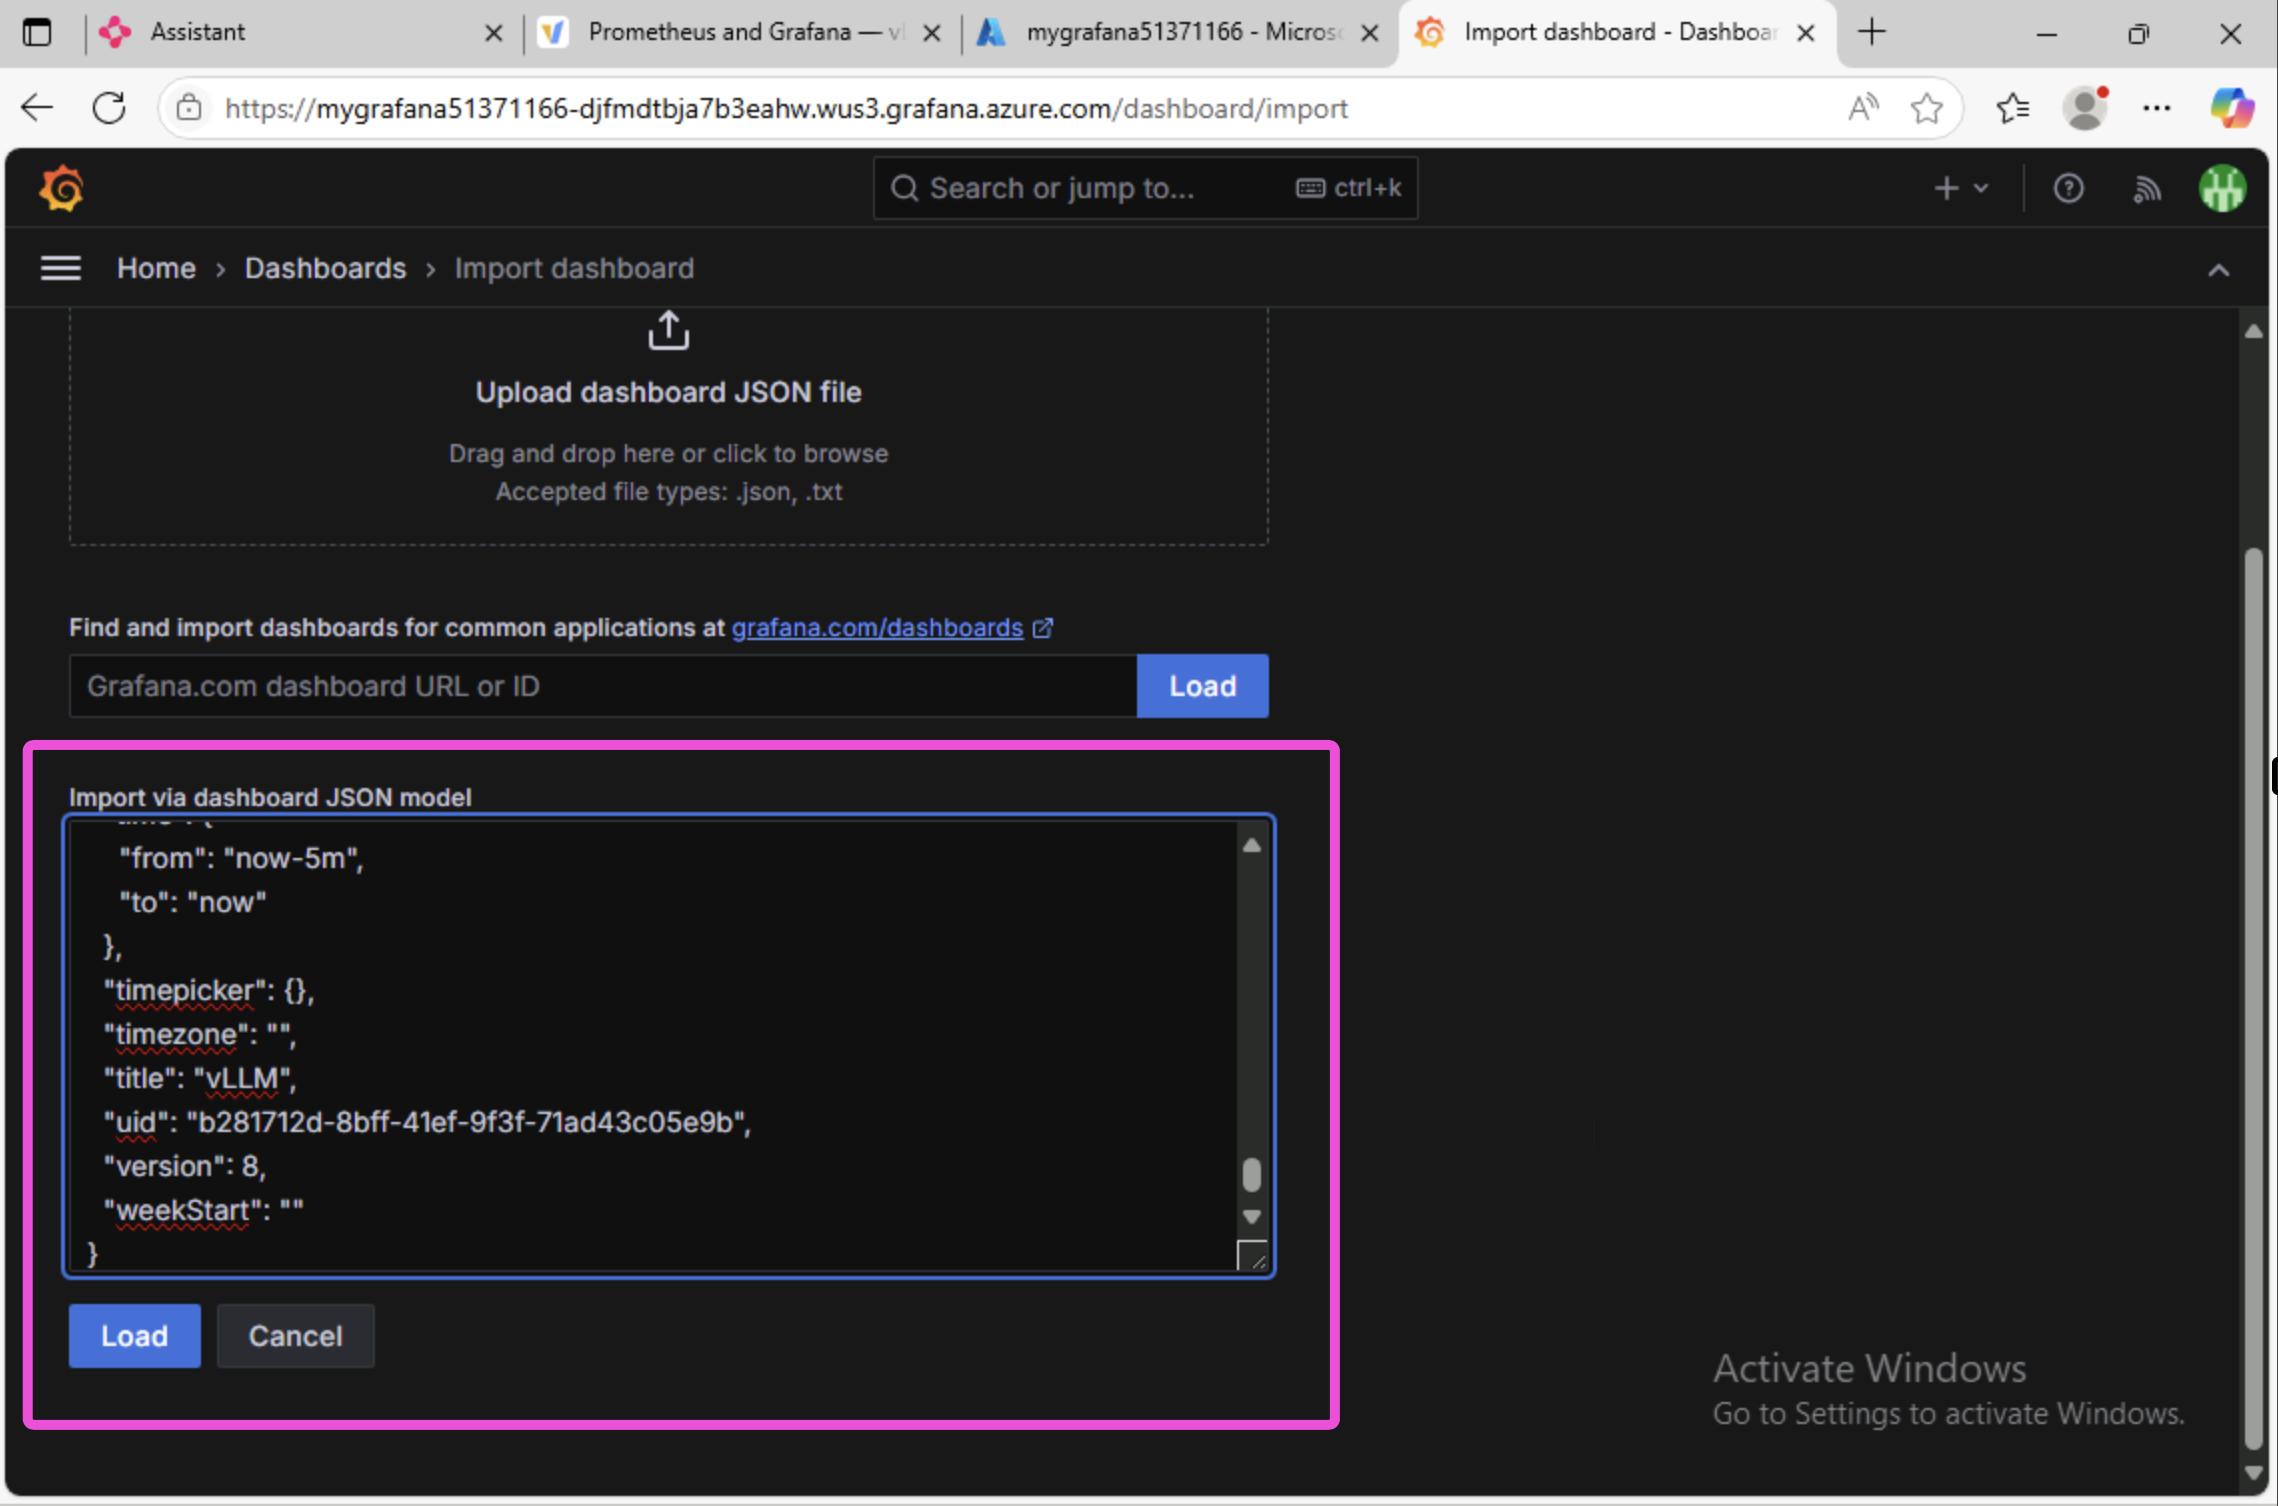
In the Import page, scroll down to the Import via panel json section and paste the JSON you copied from the vLLM docs site into the text box, then click the Load button.
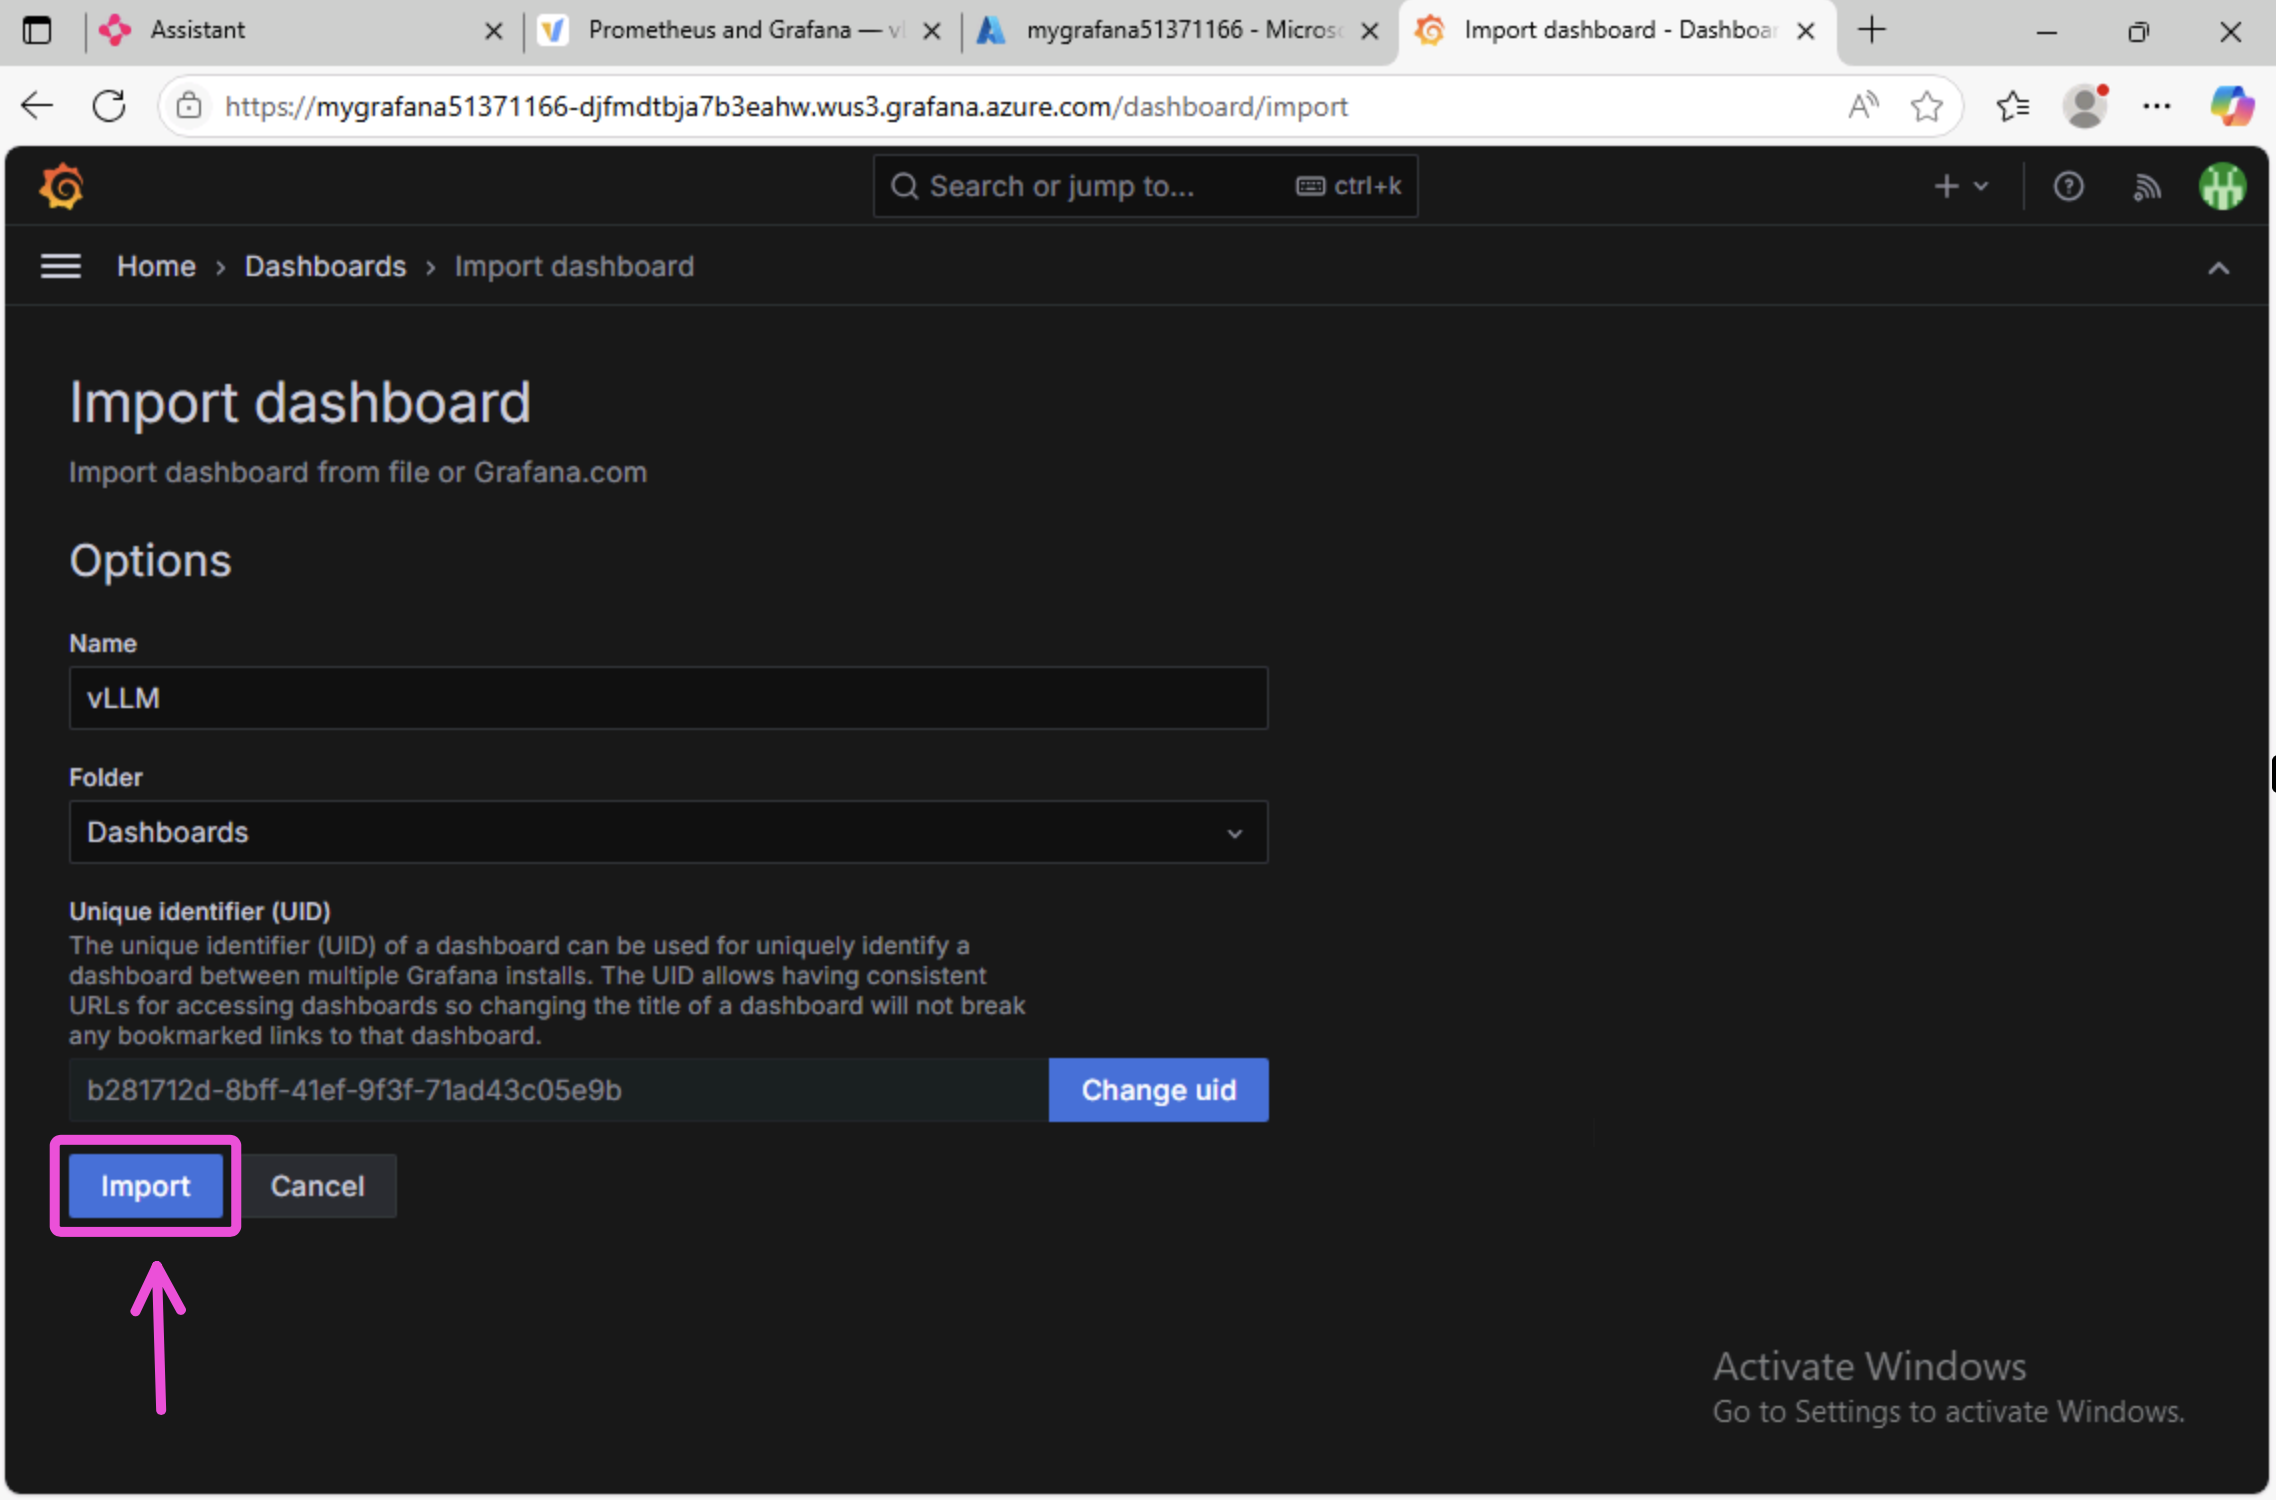
Next, click the Import button to import the dashboard.
You should see a new dashboard but with no metrics yet. Click on the model_name dropdown and type in the name of the model which is phi-4-mini-instruct then press Enter.
Your dashboard may note be populated with metrics yet. This is because the ServiceMonitor has not had a chance to scrape the metrics yet. Let's generate some metrics by sending some requests to the KAITO workspace.
Generate more metrics
To generate some metrics, you can run Chainlit app again and ask the model some more questions.
But let's take a different approach and use the REST Client extension in VS Code to send raw HTTP requests to the KAITO inference endpoint.
In VS Code, create a new file named test.http.
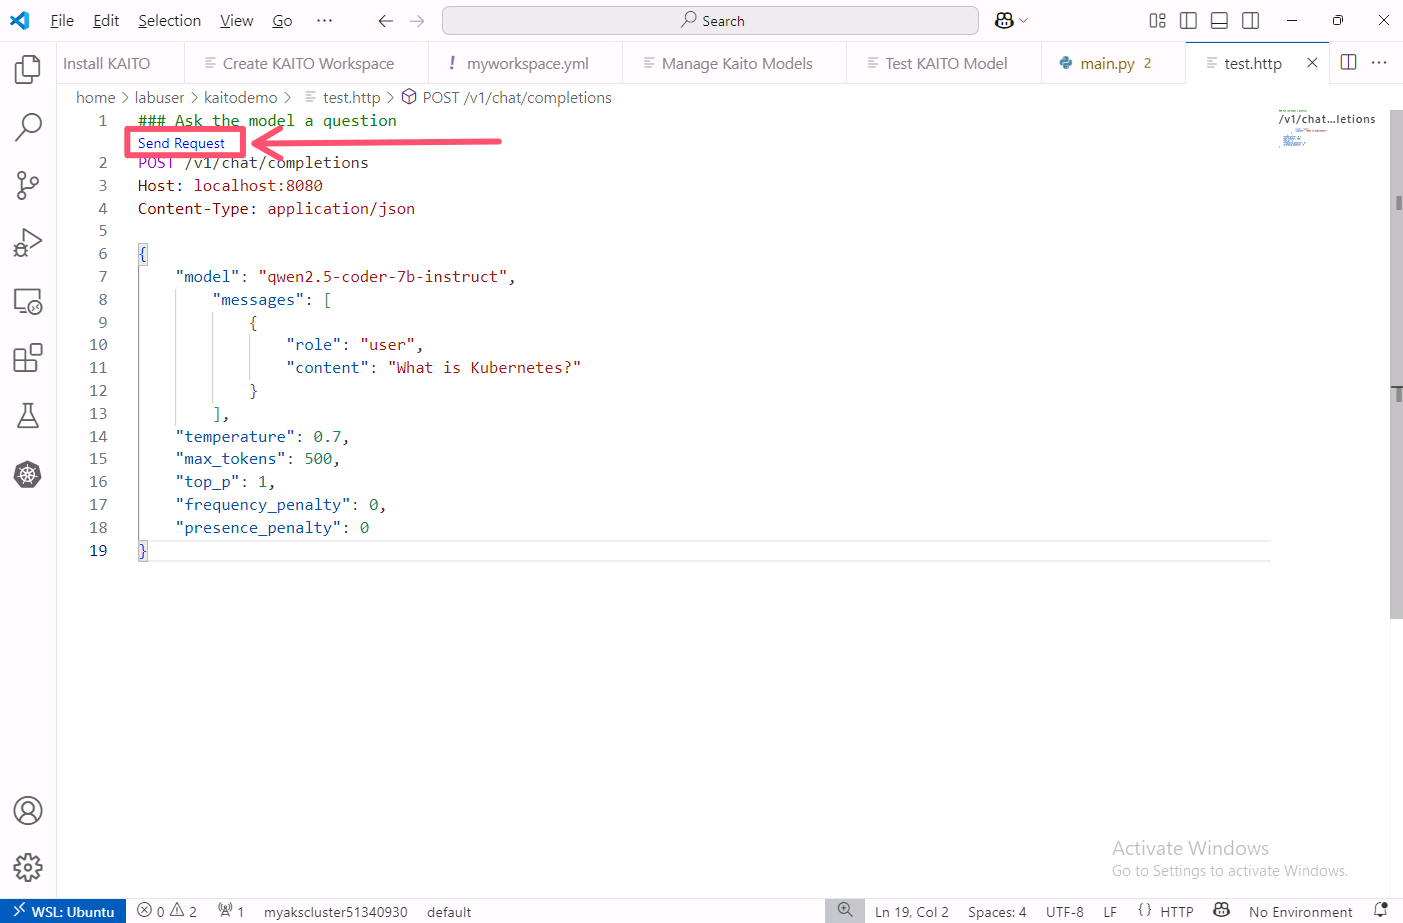
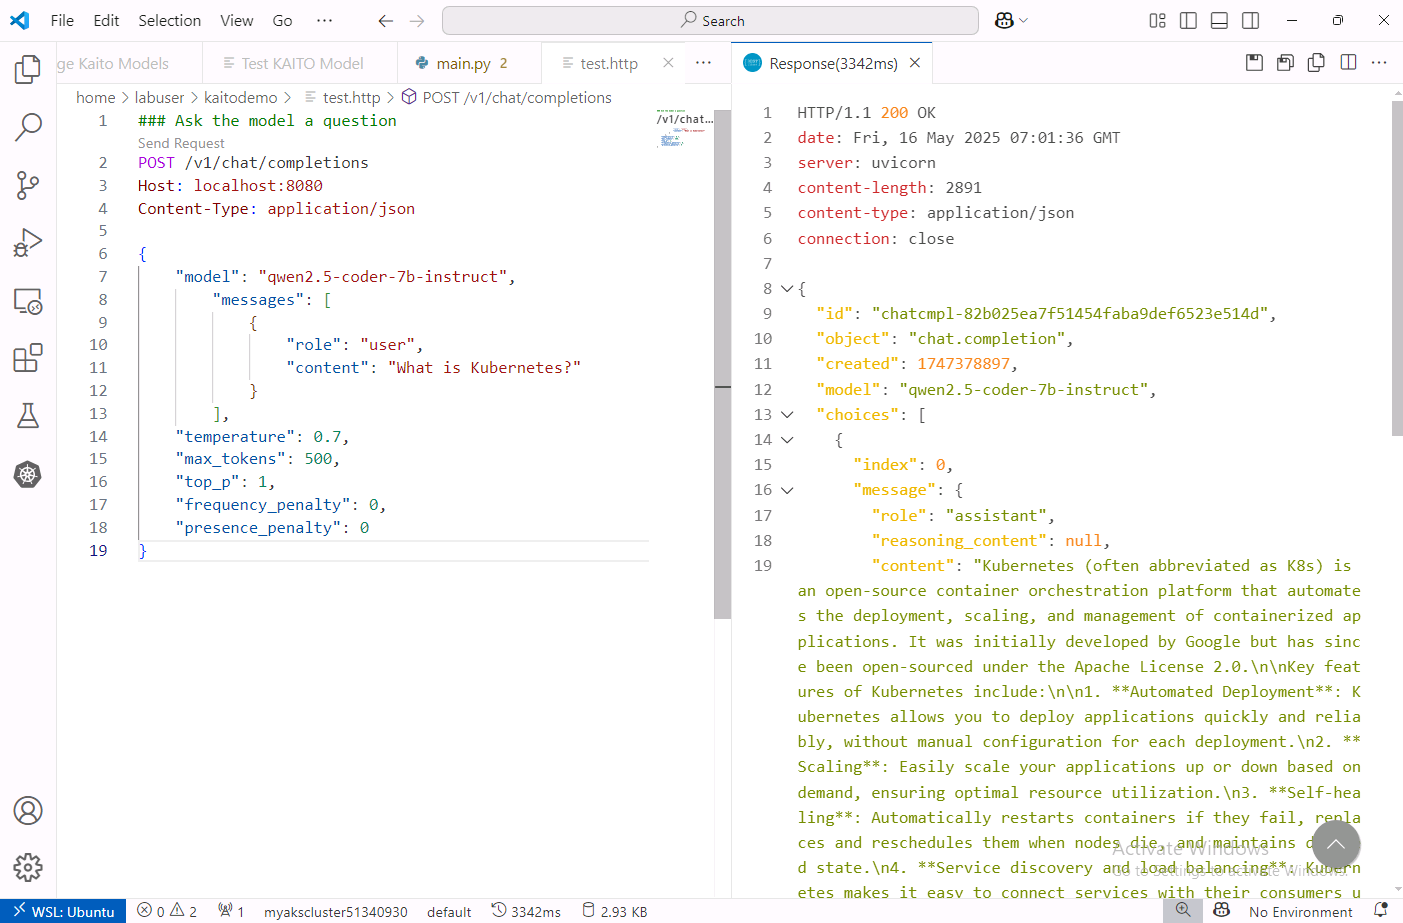
In the test.http file, add the following code to send POST requests to the inference endpoint.Be sure to update the port number in the code.
### Ask the model a question
POST /v1/chat/completions
Host: localhost:19534
Content-Type: application/json

{
    "model": "phi-4-mini-instruct",
    "messages": [
        {
            "role": "user",
            "content": "What is Kubernetes?"
        }
    ],
    "temperature": 0.7,
    "max_tokens": 500,
    "top_p": 1,
    "frequency_penalty": 0,
    "presence_penalty": 0
}
The port number 19534 is what was randomly assigned to the service in the previous step. Make sure to replace this with the port number that was assigned to your service.
The request is in the OpenAI API format which is documented here and is very similar to the request you sent from the Chainlit app.
Save the file then click on the Send Request link above the request to send the request to the KAITO workspace.
You should see a response from the KAITO workspace in a new tab on the right.
Change the question and click on the Send Request link a few more times to generate some metrics.
View metrics in Grafana
Now that you have generated some metrics, you can go back to the Azure Managed Grafana dashboard and refresh the page.
You should start to see some metrics being generated as you send requests to the KAITO workspace.
You may need to refresh the dashboard or expand the time range to see the metrics.
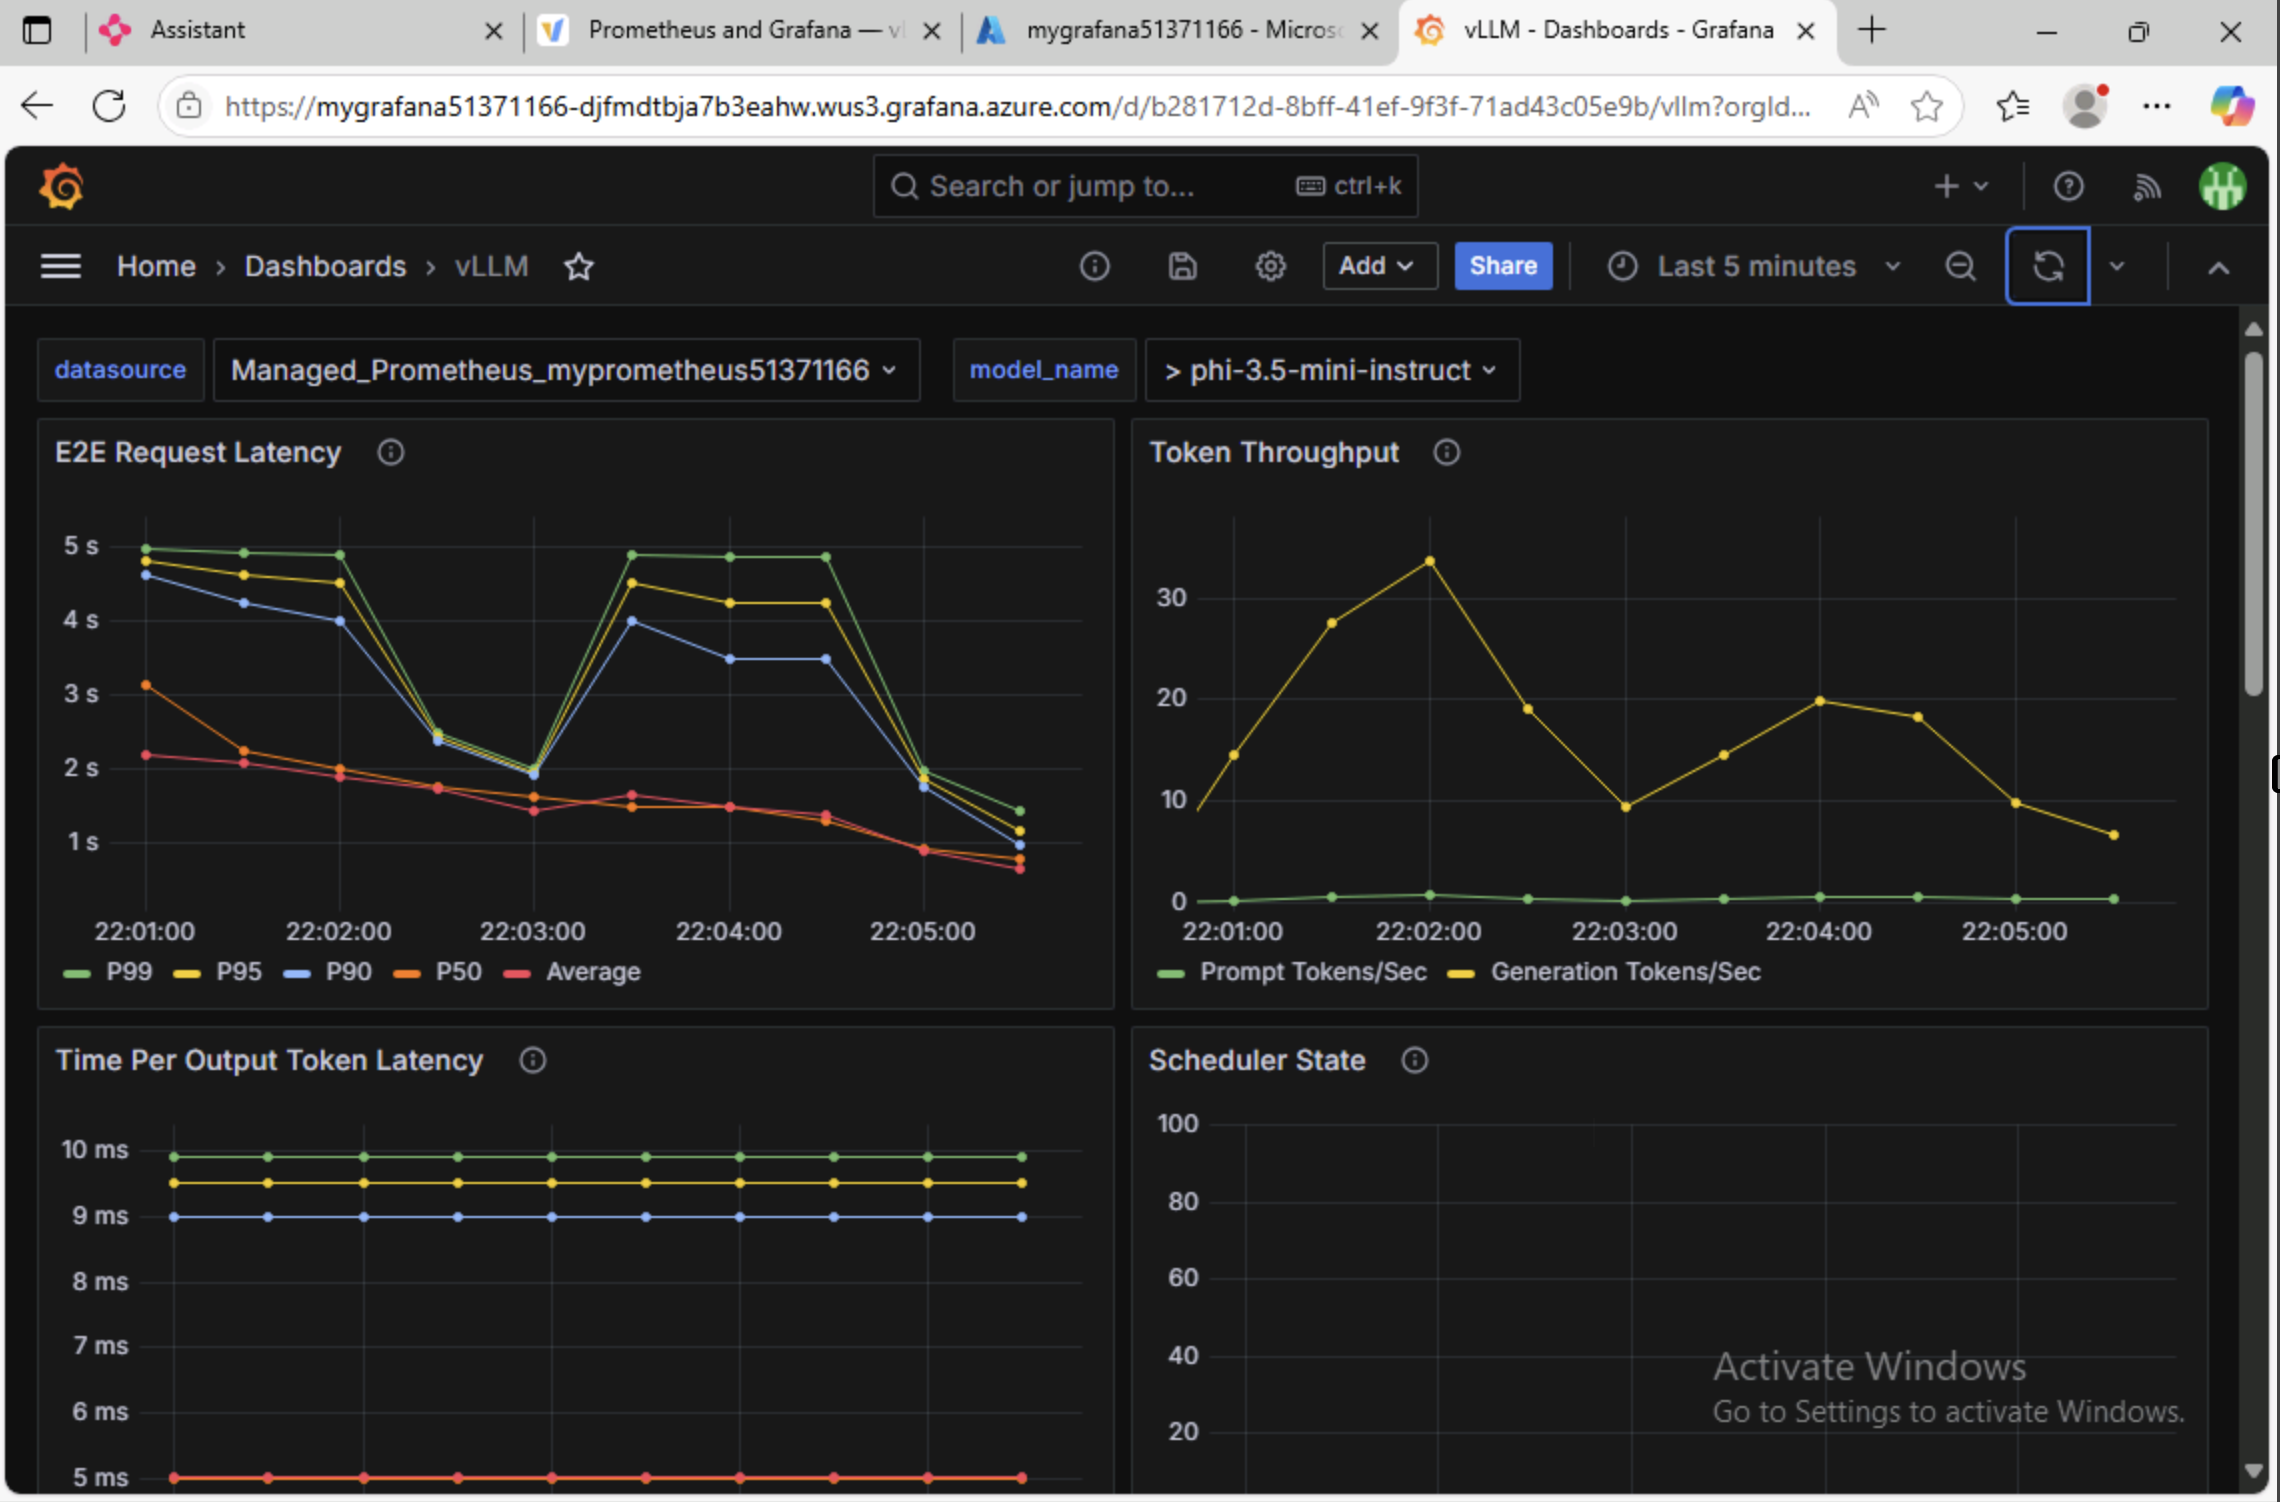
The dashboard includes several panels displaying Prometheus metrics exposed by the vLLM server. You may find these particularly useful:
- E2E Request Latency: Shows the total time (in seconds) from when an inference request is sent until the response is fully received. A key indicator of overall responsiveness.
- Token Throughput: Indicates how many tokens are processed per second during inference, reflecting the model's processing speed.
- Cache Utilization: Reports the percentage of the key-value cache in use, helping you assess memory efficiency.
- Time to First Token: Measures the delay before the first token is generated, highlighting initial response latency.
- Finish Reason: Breaks down why requests end (e.g., completed, max tokens reached, aborted), useful for diagnosing performance constraints.
Feel free to explore the dashboard and see what other metrics are available.
Summary
Congratulations, now you know how to deploy, manage, and monitor open-source AI models on AKS using KAITO!
In this workshop, you learned how to use Visual Studio Code to deploy the KAITO add-on for AKS and work with the inferencing workspace. You also learned how to monitor the KAITO workspace by scraping metrics with Azure Managed Prometheus and ServiceMonitor CRD and visualizing the metrics by importing the vLLM Grafana dashboard into Azure Managed Grafana.
You also learned a little bit about how the Chainlit library can be used to quickly create interactive chat applications with Python. The KAITO workspace defaults to using the vLLM inference runtime which is a high-performance inference engine for large language models. It's great because it is compatible with the OpenAI API and has support for metrics out-of-the-box.
With Kubernetes and KAITO, you can see how much of the heavy lifting is done for you and you can focus on building your AI applications. The KAITO operator automates the deployment and management of AI/ML workloads, allowing you to easily deploy and manage large models on AKS.
Lastly, as an added bonus, you learned how to use Headlamp to manage Kubernetes resources via a GUI. Headlamp is a great tool for managing Kubernetes resources especially for those who aren't as familiar with using the kubectl CLI.
What's next?
We've just scratched the surface of what KAITO can do. There are a few more features of KAITO that wasn't covered in this workshop, like fine-tuning models and RAG engine support. But stay tuned for more workshops on KAITO and stay up to date with the latest features and updates by following the KAITO project on GitHub.
Resources
To learn more, check out the following resources:
- Kubernetes AI Toolchain Operator
- AKS KAITO add-on
- Deploy and test inference models with the AI toolchain operator (KAITO) in Visual Studio Code
- AKS KAITO Monitoring
- Azure Managed Prometheus - Create a Pod or Service Monitor
- vLLM Metrics
- vLLM Prometheus and Grafana
- Chainlit OpenAI integrations
- Chainlit messages
- uv
- Headlamp
Cleanup
To clean up the resources created in this lab, run the following command to delete the resource group. If you want to use the resources again, you can skip this step.
az group delete \
--name ${RG_NAME} \
--yes \
--no-wait
This will delete the resource group and all its contents.